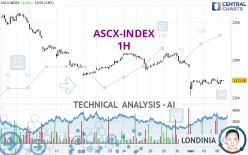
ASCX-INDEX - 1H - Technical analysis published on 05/06/2024 (GMT)
- 151
- 0
Click here for a new analysis!
- Timeframe : 1H
- - Analysis generated on
- Status : INVALID

Summary of the analysis

Additional analysis
Quotes
The ASCX-INDEX rating is 1,172.11 EUR. On the day, this instrument lost -0.09% and was between 1,167.46 EUR and 1,174.87 EUR. This implies that the price is at +0.40% from its lowest and at -0.23% from its highest.The Central Gaps scanner detects a bearish opening. A small advantage for sellers in the very short term.
Bearish opening
Type : Bearish
Timeframe : Openning
Here is a more detailed summary of the historical variations registered by ASCX-INDEX:
Near a new LOW record (1 year)
Type : Bearish
Timeframe : Weekly
Near a new LOW record (1st january)
Type : Bearish
Timeframe : Weekly
Near a new LOW record (1 month)
Type : Bearish
Timeframe : Weekly
Technical
Technical analysis of ASCX-INDEX in 1H shows a overall strongly bearish trend. 82.14% of the signals given by moving averages are bearish. Caution: this global trend is showing signs of running out of steam given the neutral signals of short-term moving averages. An assessment of moving averages reveals several bearish and bullish signals:
Bullish trend reversal : Moving Average 20
Type : Bullish
Timeframe : 1 hour
Bearish price crossover with Moving Average 20
Type : Bearish
Timeframe : 1 hour
The technical indicators are generally neutral. They do not provide relevant information on the direction of future price movements.
Other results related to technical indicators were also found by the Central Indicators scanner:
Price is back under the pivot point
Type : Bearish
Timeframe : 1 hour
Momentum indicator is back under 0
Type : Bearish
Timeframe : 1 hour
Central Patterns, the scanner specializing in chart patterns, did not identify any signals.
The Central Candlesticks scanner which studies Japanese candlesticks did not detect anything.
| S3 | S2 | S1 | Price | R1 | R2 | R3 | |
|---|---|---|---|---|---|---|---|
| ProTrendLines | 1,137.86 | 1,153.21 | 1,166.60 | 1,172.11 | 1,178.16 | 1,209.59 | 1,235.51 |
| Change (%) | -2.92% | -1.61% | -0.47% | - | +0.52% | +3.20% | +5.41% |
| Change | -34.25 | -18.90 | -5.51 | - | +6.05 | +37.48 | +63.40 |
| Level | Intermediate | Intermediate | Minor | - | Major | Major | Major |
Pivot points can also be used to set your price objectives. Here is the price situation in relation to pivot points:
| Pivot points | S3 | S2 | S1 | PP | R1 | R2 | R3 |
|---|---|---|---|---|---|---|---|
| Standard | 1,159.41 | 1,163.27 | 1,168.20 | 1,172.06 | 1,176.99 | 1,180.85 | 1,185.78 |
| Camarilla | 1,170.71 | 1,171.52 | 1,172.32 | 1,173.13 | 1,173.94 | 1,174.74 | 1,175.55 |
| Woodie | 1,159.95 | 1,163.54 | 1,168.74 | 1,172.33 | 1,177.53 | 1,181.12 | 1,186.32 |
| Fibonacci | 1,163.27 | 1,166.63 | 1,168.70 | 1,172.06 | 1,175.42 | 1,177.49 | 1,180.85 |
| Pivot points | S3 | S2 | S1 | PP | R1 | R2 | R3 |
|---|---|---|---|---|---|---|---|
| Standard | 1,091.61 | 1,122.41 | 1,147.77 | 1,178.57 | 1,203.93 | 1,234.73 | 1,260.09 |
| Camarilla | 1,157.69 | 1,162.83 | 1,167.98 | 1,173.13 | 1,178.28 | 1,183.43 | 1,188.57 |
| Woodie | 1,088.89 | 1,121.05 | 1,145.05 | 1,177.21 | 1,201.21 | 1,233.37 | 1,257.37 |
| Fibonacci | 1,122.41 | 1,143.86 | 1,157.12 | 1,178.57 | 1,200.02 | 1,213.28 | 1,234.73 |
| Pivot points | S3 | S2 | S1 | PP | R1 | R2 | R3 |
|---|---|---|---|---|---|---|---|
| Standard | 1,069.25 | 1,123.64 | 1,157.01 | 1,211.40 | 1,244.77 | 1,299.16 | 1,332.53 |
| Camarilla | 1,166.26 | 1,174.30 | 1,182.35 | 1,190.39 | 1,198.44 | 1,206.48 | 1,214.52 |
| Woodie | 1,058.75 | 1,118.39 | 1,146.51 | 1,206.15 | 1,234.27 | 1,293.91 | 1,322.03 |
| Fibonacci | 1,123.64 | 1,157.16 | 1,177.87 | 1,211.40 | 1,244.92 | 1,265.63 | 1,299.16 |
Numerical data
The following is the status of technical indicators and moving averages registered at the time this technical analysis was created:
| RSI (14): | 42.41 | |
| MACD (12,26,9): | -4.2400 | |
| Directional Movement: | -11.25 | |
| AROON (14): | 57.14 | |
| DEMA (21): | 1,167.82 | |
| Parabolic SAR (0,02-0,02-0,2): | 1,163.27 | |
| Elder Ray (13): | 0.30 | |
| Super Trend (3,10): | 1,181.33 | |
| Zig ZAG (10): | 1,171.12 | |
| VORTEX (21): | 1.2100 | |
| Stochastique (14,3,5): | 46.91 | |
| TEMA (21): | 1,168.50 | |
| Williams %R (14): | -48.70 | |
| Chande Momentum Oscillator (20): | -1.95 | |
| Repulse (5,40,3): | -0.0500 | |
| ROCnROLL: | 2 | |
| TRIX (15,9): | -0.0700 | |
| Courbe Coppock: | 0.11 |
| MA7: | 1,186.39 | |
| MA20: | 1,210.26 | |
| MA50: | 1,208.99 | |
| MA100: | 1,206.38 | |
| MAexp7: | 1,171.47 | |
| MAexp20: | 1,174.25 | |
| MAexp50: | 1,182.93 | |
| MAexp100: | 1,192.50 | |
| Price / MA7: | -1.20% | |
| Price / MA20: | -3.15% | |
| Price / MA50: | -3.05% | |
| Price / MA100: | -2.84% | |
| Price / MAexp7: | +0.05% | |
| Price / MAexp20: | -0.18% | |
| Price / MAexp50: | -0.91% | |
| Price / MAexp100: | -1.71% |
About author
Online


Add a comment
Comments
0 comments on the analysis ASCX-INDEX - 1H