SIGNIFY NV - 1H - Technical analysis published on 01/09/2024 (GMT)
- 138
- 0
Click here for a new analysis!
- Timeframe : 1H
- - Analysis generated on
- Status : TARGET REACHED
Summary of the analysis

Additional analysis
Quotes
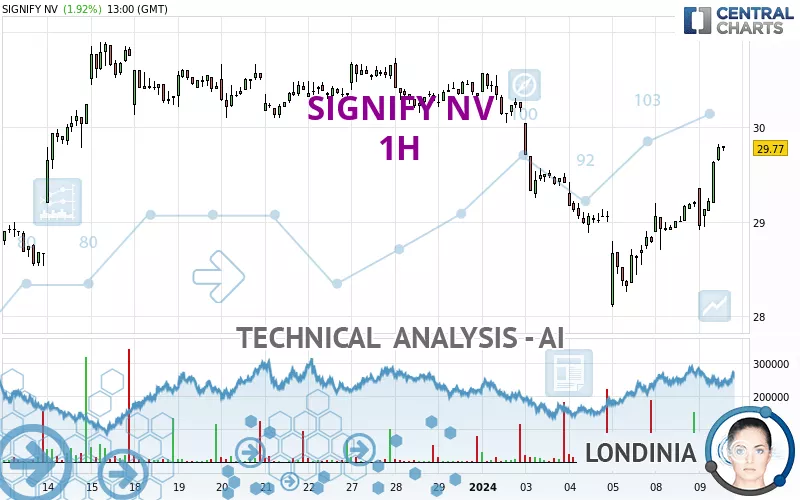
The SIGNIFY NV rating is 29.79 EUR. On the day, this instrument gained +1.99% and was traded between 28.94 EUR and 29.82 EUR over the period. The price is currently at +2.94% from its lowest and -0.10% from its highest.The Central Gaps scanner detects the formation of a bullish gap marking the strong presence of buyers against sellers at the opening. This formed a quotation gap.
Opening Gap UP
Type : Bullish
Timeframe : Openning
Here is a more detailed summary of the historical variations registered by SIGNIFY NV:
Near a new LOW record (1st january)
Type : Bearish
Timeframe : Weekly
Near a new HIGH record (1 month)
Type : Bullish
Timeframe : Weekly
Technical
Technical analysis of SIGNIFY NV in 1H shows a neutral overall trend. This indecision could turn into a bullish trend due to the strong bullish signals currently being given by short-term moving averages. The Central Indicators market scanner is currently detecting several bullish signals that could impact this trend:
Bullish trend reversal : adaptative moving average 50
Type : Bullish
Timeframe : 1 hour
Bullish trend reversal : adaptative moving average 100
Type : Bullish
Timeframe : 1 hour
An assessment of technical indicators shows a strong bullish signal.
Caution: the Central Indicators scanner currently detects an excess:
CCI indicator is overbought : over 100
Type : Neutral
Timeframe : 1 hour
Williams %R indicator is overbought : over -20
Type : Neutral
Timeframe : 1 hour
Pivot points : price is over resistance 2
Type : Neutral
Timeframe : 1 hour
Price is back over the pivot point
Type : Bullish
Timeframe : Weekly
Central Patterns, the market scanner focusing on chart patterns, resistances and supports found these results:
Near horizontal resistance
Type : Bearish
Timeframe : 1 hour
Resistance of channel is broken
Type : Bullish
Timeframe : 1 hour
The Central Candlesticks scanner, specialised in Japanese candlesticks, did not identify any signals.
| S3 | S2 | S1 | Price | R1 | R2 | R3 | |
|---|---|---|---|---|---|---|---|
| ProTrendLines | 28.10 | 28.54 | 28.99 | 29.79 | 30.10 | 30.74 | 32.81 |
| Change (%) | -5.67% | -4.20% | -2.69% | - | +1.04% | +3.19% | +10.14% |
| Change | -1.69 | -1.25 | -0.80 | - | +0.31 | +0.95 | +3.02 |
| Level | Intermediate | Minor | Major | - | Intermediate | Major | Intermediate |
Pivot points can also be used to set your price objectives. Here is the price situation in relation to pivot points:
| Pivot points | S3 | S2 | S1 | PP | R1 | R2 | R3 |
|---|---|---|---|---|---|---|---|
| Standard | 28.35 | 28.52 | 28.87 | 29.04 | 29.39 | 29.56 | 29.91 |
| Camarilla | 29.07 | 29.12 | 29.16 | 29.21 | 29.26 | 29.31 | 29.35 |
| Woodie | 28.43 | 28.57 | 28.95 | 29.09 | 29.47 | 29.61 | 29.99 |
| Fibonacci | 28.52 | 28.72 | 28.85 | 29.04 | 29.24 | 29.37 | 29.56 |
| Pivot points | S3 | S2 | S1 | PP | R1 | R2 | R3 |
|---|---|---|---|---|---|---|---|
| Standard | 25.27 | 26.69 | 27.73 | 29.15 | 30.19 | 31.61 | 32.65 |
| Camarilla | 28.10 | 28.33 | 28.56 | 28.78 | 29.01 | 29.23 | 29.46 |
| Woodie | 25.09 | 26.60 | 27.55 | 29.06 | 30.01 | 31.52 | 32.47 |
| Fibonacci | 26.69 | 27.63 | 28.21 | 29.15 | 30.09 | 30.67 | 31.61 |
| Pivot points | S3 | S2 | S1 | PP | R1 | R2 | R3 |
|---|---|---|---|---|---|---|---|
| Standard | 23.93 | 25.43 | 27.88 | 29.38 | 31.83 | 33.33 | 35.78 |
| Camarilla | 29.23 | 29.60 | 29.96 | 30.32 | 30.68 | 31.04 | 31.41 |
| Woodie | 24.40 | 25.67 | 28.35 | 29.62 | 32.30 | 33.57 | 36.25 |
| Fibonacci | 25.43 | 26.94 | 27.87 | 29.38 | 30.89 | 31.82 | 33.33 |
Numerical data
The following are the details of the technical indicators and moving averages that were collected to generate this technical analysis:
| RSI (14): | 67.42 | |
| MACD (12,26,9): | 0.0800 | |
| Directional Movement: | 17.78 | |
| AROON (14): | 85.71 | |
| DEMA (21): | 29.20 | |
| Parabolic SAR (0,02-0,02-0,2): | 29.04 | |
| Elder Ray (13): | 0.51 | |
| Super Trend (3,10): | 29.11 | |
| Zig ZAG (10): | 29.77 | |
| VORTEX (21): | 1.2500 | |
| Stochastique (14,3,5): | 91.78 | |
| TEMA (21): | 29.44 | |
| Williams %R (14): | -2.70 | |
| Chande Momentum Oscillator (20): | 0.86 | |
| Repulse (5,40,3): | 2.0600 | |
| ROCnROLL: | 1 | |
| TRIX (15,9): | -0.0200 | |
| Courbe Coppock: | 4.11 |
| MA7: | 29.53 | |
| MA20: | 29.74 | |
| MA50: | 27.80 | |
| MA100: | 26.40 | |
| MAexp7: | 29.37 | |
| MAexp20: | 29.15 | |
| MAexp50: | 29.31 | |
| MAexp100: | 29.49 | |
| Price / MA7: | +0.88% | |
| Price / MA20: | +0.17% | |
| Price / MA50: | +7.16% | |
| Price / MA100: | +12.84% | |
| Price / MAexp7: | +1.43% | |
| Price / MAexp20: | +2.20% | |
| Price / MAexp50: | +1.64% | |
| Price / MAexp100: | +1.02% |
News
Don't forget to follow the news on SIGNIFY NV. At the time of publication of this analysis, the latest news was as follows:
- Signify proposes changes to its Supervisory Board
- Signify proposes re-appointment of CEO and announces changes to the Board of Management
- Signify announces new customer-centric organization and structural cost reductions
- Signify reports third quarter sales of EUR 1.6 billion, operational profitability of 10.7% and a free cash flow of EUR 152 million
- Correction: Signify reports second quarter sales of EUR 1.6 billion, operational profitability of 8.3% and a free cash flow of EUR 88 million
About author
Online


Add a comment
Comments
0 comments on the analysis SIGNIFY NV - 1H