JUST EAT TAKEAWAY - Daily - Technical analysis published on 10/23/2019 (GMT)
- 349
- 0
- Who voted?
Click here for a new analysis!
- Timeframe : Daily
- - Analysis generated on
- Status : INVALID

Summary of the analysis

Additional analysis
Quotes
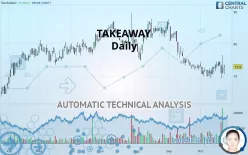
The TAKEAWAY price is 72.90 EUR. On the day, this instrument gained +0.48% and was traded between 70.50 EUR and 73.45 EUR over the period. The price is currently at +3.40% from its lowest and -0.75% from its highest.A bullish opening was detected by the Central Gaps scanner. Buyers are trying to impose a bullish momentum in the very short term.
Bullish opening
Type : Bullish
Timeframe : Openning
Here is a more detailed summary of the historical variations registered by TAKEAWAY:
Abnormal volumes
Timeframe : 5 days
Technical
A technical analysis in Daily of this TAKEAWAY chart shows a sharp bearish trend. 82.14% of the signals given by moving averages are bearish. Caution: as the signals currently given by short-term moving averages are rather neutral, the global trend is slowing down. The Central Indicators market scanner is currently detecting several bullish signals that could impact this trend:
Bullish price crossover with Moving Average 20
Type : Bullish
Timeframe : Daily
Bullish price crossover with adaptative moving average 20
Type : Bullish
Timeframe : Daily
In fact, 10 technical indicators on 18 studied are currently positioned bullish. Caution: the Central Indicators scanner currently detects an excess:
Williams %R indicator is overbought : over -20
Type : Neutral
Timeframe : Daily
Parabolic SAR indicator bullish reversal
Type : Bullish
Timeframe : Daily
Price is back over the pivot point
Type : Bullish
Timeframe : Weekly
Momentum indicator is back over 0
Type : Bullish
Timeframe : Daily
The Central Patterns scanner, which studies chart patterns, resistances and supports, has identified these signals:
Horizontal support is broken
Type : Bearish
Timeframe : Daily
Support of channel is broken
Type : Bearish
Timeframe : Daily
No result was found by the Central Candlesticks scanner on Japanese candlesticks.
| S3 | S2 | S1 | Price | R1 | R2 | R3 | |
|---|---|---|---|---|---|---|---|
| ProTrendLines | 54.20 | 64.40 | 68.32 | 72.90 | 75.75 | 80.04 | 83.53 |
| Change (%) | -25.65% | -11.66% | -6.28% | - | +3.91% | +9.79% | +14.58% |
| Change | -18.70 | -8.50 | -4.58 | - | +2.85 | +7.14 | +10.63 |
| Level | Major | Major | Major | - | Intermediate | Intermediate | Minor |
Pivot points can also be used to set your price objectives. Here is the price situation in relation to pivot points:
| Pivot points | S3 | S2 | S1 | PP | R1 | R2 | R3 |
|---|---|---|---|---|---|---|---|
| Standard | 64.12 | 67.38 | 69.97 | 73.23 | 75.82 | 79.08 | 81.67 |
| Camarilla | 70.94 | 71.48 | 72.01 | 72.55 | 73.09 | 73.62 | 74.16 |
| Woodie | 63.78 | 67.21 | 69.63 | 73.06 | 75.48 | 78.91 | 81.33 |
| Fibonacci | 67.38 | 69.62 | 71.00 | 73.23 | 75.47 | 76.85 | 79.08 |
| Pivot points | S3 | S2 | S1 | PP | R1 | R2 | R3 |
|---|---|---|---|---|---|---|---|
| Standard | 67.92 | 69.48 | 71.47 | 73.03 | 75.02 | 76.58 | 78.57 |
| Camarilla | 72.47 | 72.80 | 73.13 | 73.45 | 73.78 | 74.10 | 74.43 |
| Woodie | 68.13 | 69.59 | 71.68 | 73.14 | 75.23 | 76.69 | 78.78 |
| Fibonacci | 69.48 | 70.84 | 71.68 | 73.03 | 74.39 | 75.23 | 76.58 |
| Pivot points | S3 | S2 | S1 | PP | R1 | R2 | R3 |
|---|---|---|---|---|---|---|---|
| Standard | 51.60 | 61.70 | 67.45 | 77.55 | 83.30 | 93.40 | 99.15 |
| Camarilla | 68.84 | 70.29 | 71.75 | 73.20 | 74.65 | 76.11 | 77.56 |
| Woodie | 49.43 | 60.61 | 65.28 | 76.46 | 81.13 | 92.31 | 96.98 |
| Fibonacci | 61.70 | 67.76 | 71.50 | 77.55 | 83.61 | 87.35 | 93.40 |
Numerical data
The following are the details of the technical indicators and moving averages that were collected to generate this technical analysis:
| RSI (14): | 46.89 | |
| MACD (12,26,9): | -0.9600 | |
| Directional Movement: | -3.64 | |
| AROON (14): | 57.15 | |
| DEMA (21): | 71.46 | |
| Parabolic SAR (0,02-0,02-0,2): | 69.25 | |
| Elder Ray (13): | -0.67 | |
| Super Trend (3,10): | 76.23 | |
| Zig ZAG (10): | 72.95 | |
| VORTEX (21): | 0.9400 | |
| Stochastique (14,3,5): | 43.30 | |
| TEMA (21): | 72.16 | |
| Williams %R (14): | -48.63 | |
| Chande Momentum Oscillator (20): | 1.25 | |
| Repulse (5,40,3): | 0.1400 | |
| ROCnROLL: | -1 | |
| TRIX (15,9): | -0.2900 | |
| Courbe Coppock: | 2.23 |
| MA7: | 72.99 | |
| MA20: | 72.25 | |
| MA50: | 77.06 | |
| MA100: | 79.16 | |
| MAexp7: | 72.61 | |
| MAexp20: | 73.03 | |
| MAexp50: | 75.48 | |
| MAexp100: | 76.27 | |
| Price / MA7: | -0.12% | |
| Price / MA20: | +0.90% | |
| Price / MA50: | -5.40% | |
| Price / MA100: | -7.91% | |
| Price / MAexp7: | +0.40% | |
| Price / MAexp20: | -0.18% | |
| Price / MAexp50: | -3.42% | |
| Price / MAexp100: | -4.42% |
News
The last news published on TAKEAWAY at the time of the generation of this analysis was as follows:
- Form 8.3 - The Vanguard Group, Inc.: Takeaway.com N.V.
- Form 8.3 - The Vanguard Group, Inc.: Takeaway.com N.V.
- Form 8.3 - The Vanguard Group, Inc.: Takeaway.com N.V.
- Form 8.3 - The Vanguard Group, Inc.: Takeaway.com N.V.
- Form 8.3 - The Vanguard Group, Inc.: Takeaway.com N.V.
About author

Online


Add a comment
Comments
0 comments on the analysis JUST EAT TAKEAWAY - Daily