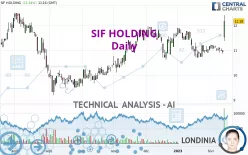
SIF HOLDING - Daily - Technical analysis published on 02/14/2023 (GMT)
- 227
- 0
Click here for a new analysis!
- Timeframe : Daily
- - Analysis generated on
- Status : TARGET REACHED

Summary of the analysis

Additional analysis
Quotes
The SIF HOLDING price is 12.18 EUR. The price has increased by +11.54% since the last closing and was between 11.38 EUR and 12.42 EUR. This implies that the price is at +7.03% from its lowest and at -1.93% from its highest.The Central Gaps scanner detects the formation of a bullish gap marking the strong presence of buyers against sellers at the opening. This formed a quotation gap.
Opening Gap UP
Type : Bullish
Timeframe : Openning
So that you have an overall view of the price change, here is a table showing the variations over several periods:
New HIGH record (1st january)
Type : Bullish
Timeframe : Weekly
New HIGH record (1 month)
Type : Bullish
Timeframe : Weekly
Technical
Technical analysis of SIF HOLDING in Daily shows a strongly overall bullish trend. 89.29% of the signals given by moving averages are bullish. This strongly bullish trend is supported by the strong bullish signals given by short-term moving averages. The Central Indicators market scanner is currently detecting several bullish signals that could impact this trend:
Moving Average bullish crossovers : AMA20 & AMA50
Type : Bullish
Timeframe : Daily
Bullish price crossover with Moving Average 20
Type : Bullish
Timeframe : Daily
Bullish price crossover with Moving Average 50
Type : Bullish
Timeframe : Daily
Bullish price crossover with adaptative moving average 20
Type : Bullish
Timeframe : Daily
Bullish price crossover with adaptative moving average 50
Type : Bullish
Timeframe : Daily
Bullish price crossover with adaptative moving average 100
Type : Bullish
Timeframe : Daily
In fact, according to the parameters integrated into the Central Analyzer system, 15 technical indicators out of 18 analysed are currently bullish. But beware of excesses. The Central Indicators scanner currently detects this:
CCI indicator is overbought : over 100
Type : Neutral
Timeframe : Daily
MACD indicator: bullish divergence
Type : Bullish
Timeframe : Daily
RSI indicator: bullish divergence
Type : Bullish
Timeframe : Daily
Pivot points : price is over resistance 3
Type : Neutral
Timeframe : Daily
Pivot points : price is over resistance 3
Type : Neutral
Timeframe : Weekly
RSI indicator is back over 50
Type : Bullish
Timeframe : Daily
MACD crosses UP its Moving Average
Type : Bullish
Timeframe : Daily
Ichimoku : price is over the cloud
Type : Bullish
Timeframe : Daily
SuperTrend indicator bullish reversal
Type : Bullish
Timeframe : Daily
MACD indicator is back over 0
Type : Bullish
Timeframe : Daily
Ichimoku - Bullish crossover : Tenkan & Kijun
Type : Bullish
Timeframe : Daily
Momentum indicator is back over 0
Type : Bullish
Timeframe : Daily
Williams %R indicator is back over -50
Type : Bullish
Timeframe : Daily
Central Patterns, the market scanner focusing on chart patterns, resistances and supports found these results:
Horizontal resistance is broken
Type : Bullish
Timeframe : Daily
Resistance of channel is broken
Type : Bullish
Timeframe : Daily
Resistance of triangle is broken
Type : Bullish
Timeframe : Daily
Central Candlesticks, the scanner specialised in Japanese candlesticks, detects a bullish signal that could support the hypothesis of a small rebound in the very short term:
Long white line
Type : Bullish
Timeframe : Daily
| S3 | S2 | S1 | Price | R1 | R2 | R3 | |
|---|---|---|---|---|---|---|---|
| ProTrendLines | 10.71 | 11.20 | 11.91 | 12.18 | 12.48 | 13.41 | 15.92 |
| Change (%) | -12.07% | -8.05% | -2.22% | - | +2.46% | +10.10% | +30.71% |
| Change | -1.47 | -0.98 | -0.27 | - | +0.30 | +1.23 | +3.74 |
| Level | Intermediate | Intermediate | Intermediate | - | Minor | Intermediate | Minor |
To determine price objectives, it is also possible to use the pivot points. Here is the price position in relation to pivot points:
| Pivot points | S3 | S2 | S1 | PP | R1 | R2 | R3 |
|---|---|---|---|---|---|---|---|
| Standard | 10.71 | 10.79 | 10.85 | 10.93 | 10.99 | 11.07 | 11.13 |
| Camarilla | 10.88 | 10.89 | 10.91 | 10.92 | 10.93 | 10.95 | 10.96 |
| Woodie | 10.71 | 10.79 | 10.85 | 10.93 | 10.99 | 11.07 | 11.13 |
| Fibonacci | 10.79 | 10.84 | 10.87 | 10.93 | 10.98 | 11.01 | 11.07 |
| Pivot points | S3 | S2 | S1 | PP | R1 | R2 | R3 |
|---|---|---|---|---|---|---|---|
| Standard | 10.58 | 10.74 | 10.86 | 11.02 | 11.14 | 11.30 | 11.42 |
| Camarilla | 10.90 | 10.93 | 10.95 | 10.98 | 11.01 | 11.03 | 11.06 |
| Woodie | 10.56 | 10.73 | 10.84 | 11.01 | 11.12 | 11.29 | 11.40 |
| Fibonacci | 10.74 | 10.85 | 10.91 | 11.02 | 11.13 | 11.19 | 11.30 |
| Pivot points | S3 | S2 | S1 | PP | R1 | R2 | R3 |
|---|---|---|---|---|---|---|---|
| Standard | 9.41 | 10.05 | 10.61 | 11.25 | 11.81 | 12.45 | 13.01 |
| Camarilla | 10.83 | 10.94 | 11.05 | 11.16 | 11.27 | 11.38 | 11.49 |
| Woodie | 9.36 | 10.03 | 10.56 | 11.23 | 11.76 | 12.43 | 12.96 |
| Fibonacci | 10.05 | 10.51 | 10.80 | 11.25 | 11.71 | 12.00 | 12.45 |
Numerical data
The following are the details of the technical indicators and moving averages that were collected to generate this technical analysis:
| RSI (14): | 70.10 | |
| MACD (12,26,9): | 0.0200 | |
| Directional Movement: | 31.46 | |
| AROON (14): | 7.14 | |
| DEMA (21): | 11.19 | |
| Parabolic SAR (0,02-0,02-0,2): | 10.78 | |
| Elder Ray (13): | 0.69 | |
| Super Trend (3,10): | 10.94 | |
| Zig ZAG (10): | 12.18 | |
| VORTEX (21): | 0.9700 | |
| Stochastique (14,3,5): | 51.48 | |
| TEMA (21): | 11.25 | |
| Williams %R (14): | -15.38 | |
| Chande Momentum Oscillator (20): | 1.22 | |
| Repulse (5,40,3): | 6.0600 | |
| ROCnROLL: | 1 | |
| TRIX (15,9): | -0.0800 | |
| Courbe Coppock: | 5.04 |
| MA7: | 11.19 | |
| MA20: | 11.07 | |
| MA50: | 11.30 | |
| MA100: | 10.95 | |
| MAexp7: | 11.31 | |
| MAexp20: | 11.19 | |
| MAexp50: | 11.18 | |
| MAexp100: | 11.07 | |
| Price / MA7: | +8.85% | |
| Price / MA20: | +10.03% | |
| Price / MA50: | +7.79% | |
| Price / MA100: | +11.23% | |
| Price / MAexp7: | +7.69% | |
| Price / MAexp20: | +8.85% | |
| Price / MAexp50: | +8.94% | |
| Price / MAexp100: | +10.03% |
News
The last news published on SIF HOLDING at the time of the generation of this analysis was as follows:
- Anthony Eames Elected To US SIF Board of Directors
-
 SIFCO Industries, Inc. - SIF Stock Chart Technical Analysis for 05-13-2020
- Sif preferred supplier for 33 Monopiles and 33 Transition Pieces
- Sif provides Monopiles and Transition Pieces for Saint- Nazaire Offshore Wind Farm Project
- Zengtao Wu of Southern Asset Management addresses 7th China SIF on ESG Integration Strategies
About author
Online


Add a comment
Comments
0 comments on the analysis SIF HOLDING - Daily