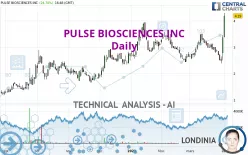
PULSE BIOSCIENCES INC - Daily - Technical analysis published on 04/03/2023 (GMT)
- 198
- 0
Click here for a new analysis!
- Timeframe : Daily
- - Analysis generated on
- Status : INVALID

Summary of the analysis

Additional analysis
Quotes
PULSE BIOSCIENCES INC rating 4.19 USD. The price has increased by +24.70% since the last closing and was traded between 3.37 USD and 4.29 USD over the period. The price is currently at +24.33% from its lowest and -2.33% from its highest.A study of price movements over other periods shows the following variations:
New HIGH record (1 month)
Type : Bullish
Timeframe : Weekly
Technical
A technical analysis in Daily of this PULSE BIOSCIENCES INC chart shows a strongly bullish trend. 92.86% of the signals given by moving averages are bullish. The overall trend is supported by the strong bullish signals from short-term moving averages. The Central Indicators market scanner is currently detecting several bullish signals that could impact this trend:
Bullish trend reversal : Moving Average 20
Type : Bullish
Timeframe : Daily
Bullish trend reversal : Moving Average 50
Type : Bullish
Timeframe : Daily
Bullish trend reversal : adaptative moving average 20
Type : Bullish
Timeframe : Daily
Bullish trend reversal : adaptative moving average 50
Type : Bullish
Timeframe : Daily
Bullish trend reversal : adaptative moving average 100
Type : Bullish
Timeframe : Daily
In fact, according to the parameters integrated into the Central Analyzer system, 14 technical indicators out of 18 analysed are currently bullish. But beware of excesses. The Central Indicators scanner currently detects this:
CCI indicator is overbought : over 100
Type : Neutral
Timeframe : Daily
Williams %R indicator is overbought : over -20
Type : Neutral
Timeframe : Daily
Pivot points : price is over resistance 1
Type : Neutral
Timeframe : Weekly
Pivot points : price is over resistance 2
Type : Neutral
Timeframe : Daily
MACD crosses UP its Moving Average
Type : Bullish
Timeframe : Daily
Aroon indicator bullish trend
Type : Bullish
Timeframe : Daily
MACD indicator is back over 0
Type : Bullish
Timeframe : Daily
Central Patterns, the scanner specializing in chart patterns, did not identify any signals.
No result was found by the Central Candlesticks scanner on Japanese candlesticks.
| S3 | S2 | S1 | Price | R1 | R2 | R3 | |
|---|---|---|---|---|---|---|---|
| ProTrendLines | 3.21 | 3.47 | 3.88 | 4.19 | 5.28 | 16.24 | 26.63 |
| Change (%) | -23.39% | -17.18% | -7.40% | - | +26.01% | +287.59% | +535.56% |
| Change | -0.98 | -0.72 | -0.31 | - | +1.09 | +12.05 | +22.44 |
| Level | Intermediate | Major | Intermediate | - | Minor | Minor | Minor |
Pivot points can also be used to set your price objectives. Here is the price situation in relation to pivot points:
| Pivot points | S3 | S2 | S1 | PP | R1 | R2 | R3 |
|---|---|---|---|---|---|---|---|
| Standard | 1.78 | 2.13 | 2.75 | 3.10 | 3.72 | 4.07 | 4.69 |
| Camarilla | 3.09 | 3.18 | 3.27 | 3.36 | 3.45 | 3.54 | 3.63 |
| Woodie | 1.91 | 2.20 | 2.88 | 3.17 | 3.85 | 4.14 | 4.82 |
| Fibonacci | 2.13 | 2.50 | 2.73 | 3.10 | 3.47 | 3.70 | 4.07 |
| Pivot points | S3 | S2 | S1 | PP | R1 | R2 | R3 |
|---|---|---|---|---|---|---|---|
| Standard | 1.59 | 1.99 | 2.67 | 3.07 | 3.75 | 4.15 | 4.83 |
| Camarilla | 3.06 | 3.16 | 3.26 | 3.36 | 3.46 | 3.56 | 3.66 |
| Woodie | 1.74 | 2.06 | 2.82 | 3.14 | 3.90 | 4.22 | 4.98 |
| Fibonacci | 1.99 | 2.40 | 2.65 | 3.07 | 3.48 | 3.73 | 4.15 |
| Pivot points | S3 | S2 | S1 | PP | R1 | R2 | R3 |
|---|---|---|---|---|---|---|---|
| Standard | 1.54 | 1.96 | 2.66 | 3.08 | 3.78 | 4.20 | 4.90 |
| Camarilla | 3.05 | 3.16 | 3.26 | 3.36 | 3.46 | 3.57 | 3.67 |
| Woodie | 1.68 | 2.03 | 2.80 | 3.15 | 3.92 | 4.27 | 5.04 |
| Fibonacci | 1.96 | 2.39 | 2.65 | 3.08 | 3.51 | 3.77 | 4.20 |
Numerical data
The following is the status of the technical indicators and moving averages at the time of publication of this technical analysis:
| RSI (14): | 67.29 | |
| MACD (12,26,9): | 0.0400 | |
| Directional Movement: | 21.27 | |
| AROON (14): | 14.29 | |
| DEMA (21): | 3.05 | |
| Parabolic SAR (0,02-0,02-0,2): | 2.38 | |
| Elder Ray (13): | 0.60 | |
| Super Trend (3,10): | 2.74 | |
| Zig ZAG (10): | 3.88 | |
| VORTEX (21): | 1.1300 | |
| Stochastique (14,3,5): | 66.35 | |
| TEMA (21): | 3.15 | |
| Williams %R (14): | 0.00 | |
| Chande Momentum Oscillator (20): | 0.97 | |
| Repulse (5,40,3): | 34.4200 | |
| ROCnROLL: | 1 | |
| TRIX (15,9): | 0.0000 | |
| Courbe Coppock: | 2.56 |
| MA7: | 2.99 | |
| MA20: | 3.05 | |
| MA50: | 3.00 | |
| MA100: | 2.75 | |
| MAexp7: | 3.18 | |
| MAexp20: | 3.00 | |
| MAexp50: | 2.94 | |
| MAexp100: | 2.78 | |
| Price / MA7: | +40.13% | |
| Price / MA20: | +37.38% | |
| Price / MA50: | +39.67% | |
| Price / MA100: | +52.36% | |
| Price / MAexp7: | +31.76% | |
| Price / MAexp20: | +39.67% | |
| Price / MAexp50: | +42.52% | |
| Price / MAexp100: | +50.72% |
News
The last news published on PULSE BIOSCIENCES INC at the time of the generation of this analysis was as follows:
- Pulse Biosciences Reports Fourth Quarter & Full Year 2022 Financial Results
- Pulse Biosciences Schedules Fourth Quarter & Full Year 2022 Financial Results Conference Call for March 30, 2023
- Pulse Biosciences Announces Its Novel Nanosecond Pulsed Field Ablation System Will Be Highlighted at the 2023 AF Symposium
- Pulse Biosciences Reports Third Quarter 2022 Financial Results
- Pulse Biosciences Schedules Third Quarter 2022 Financial Results Conference Call for November 10, 2022
About author

Online


Add a comment
Comments
0 comments on the analysis PULSE BIOSCIENCES INC - Daily