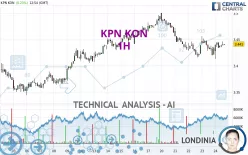
KPN KON - 1H - Technical analysis published on 05/24/2024 (GMT)
- 183
- 0
- Timeframe : 1H
- - Analysis generated on
- Status : NEUTRAL

Summary of the analysis

Additional analysis
Quotes
The KPN KON rating is 3.440 EUR. The price registered an increase of +0.20% on the session with the lowest point at 3.413 EUR and the highest point at 3.446 EUR. The deviation from the price is +0.79% for the low point and -0.17% for the high point.The Central Gaps scanner detects a bearish opening marking the presence of sellers ahead of buyers at the opening but not sufficiently marked to allow the price to register a quotation gap.
Bearish opening
Type : Bearish
Timeframe : Openning
So that you have an overall view of the price change, here is a table showing the variations over several periods:
New HIGH record (5 years)
Type : Bullish
Timeframe : Weekly
Near a new HIGH record (1 year)
Type : Bullish
Timeframe : Weekly
Near a new HIGH record (1st january)
Type : Bullish
Timeframe : Weekly
Near a new LOW record (1 month)
Type : Bearish
Timeframe : Weekly
Technical
Technical analysis of this 1H chart of KPN KON indicates that the overall trend is slightly bullish. 57.14% of the signals given by moving averages are bullish. As the signals currently given by short-term moving averages are rather neutral, the slightly bullish trend could return to neutral. The Central Indicators scanner detects a bullish signal on moving averages that could impact this trend:
Bullish trend reversal : adaptative moving average 20
Type : Bullish
Timeframe : 1 hour
An assessment of technical indicators shows a moderate bullish signal.
Other results related to technical indicators were also found by the Central Indicators scanner:
RSI indicator is back over 50
Type : Bullish
Timeframe : 1 hour
Price is back under the pivot point
Type : Bearish
Timeframe : Weekly
The Central Patterns scanner, which studies chart patterns, resistances and supports, has identified these signals:
Near horizontal resistance
Type : Bearish
Timeframe : 1 hour
Resistance of channel is broken
Type : Bullish
Timeframe : 1 hour
No result was found by the Central Candlesticks scanner on Japanese candlesticks.
| S3 | S2 | S1 | Price | R1 | R2 | R3 | |
|---|---|---|---|---|---|---|---|
| ProTrendLines | 3.356 | 3.389 | 3.416 | 3.440 | 3.442 | 3.482 | 3.494 |
| Change (%) | -2.44% | -1.48% | -0.70% | - | +0.06% | +1.22% | +1.57% |
| Change | -0.084 | -0.051 | -0.024 | - | +0.002 | +0.042 | +0.054 |
| Level | Intermediate | Minor | Intermediate | - | Major | Minor | Intermediate |
Attention could also be paid to pivot points to set price objectives:
| Pivot points | S3 | S2 | S1 | PP | R1 | R2 | R3 |
|---|---|---|---|---|---|---|---|
| Standard | 3.381 | 3.400 | 3.417 | 3.436 | 3.453 | 3.472 | 3.489 |
| Camarilla | 3.423 | 3.426 | 3.430 | 3.433 | 3.436 | 3.440 | 3.443 |
| Woodie | 3.379 | 3.400 | 3.415 | 3.436 | 3.451 | 3.472 | 3.487 |
| Fibonacci | 3.400 | 3.414 | 3.423 | 3.436 | 3.450 | 3.459 | 3.472 |
| Pivot points | S3 | S2 | S1 | PP | R1 | R2 | R3 |
|---|---|---|---|---|---|---|---|
| Standard | 3.346 | 3.377 | 3.435 | 3.466 | 3.524 | 3.555 | 3.613 |
| Camarilla | 3.470 | 3.478 | 3.486 | 3.494 | 3.502 | 3.510 | 3.519 |
| Woodie | 3.361 | 3.384 | 3.450 | 3.473 | 3.539 | 3.562 | 3.628 |
| Fibonacci | 3.377 | 3.411 | 3.432 | 3.466 | 3.500 | 3.521 | 3.555 |
| Pivot points | S3 | S2 | S1 | PP | R1 | R2 | R3 |
|---|---|---|---|---|---|---|---|
| Standard | 3.101 | 3.180 | 3.294 | 3.373 | 3.487 | 3.566 | 3.680 |
| Camarilla | 3.355 | 3.373 | 3.390 | 3.408 | 3.426 | 3.443 | 3.461 |
| Woodie | 3.119 | 3.189 | 3.312 | 3.382 | 3.505 | 3.575 | 3.698 |
| Fibonacci | 3.180 | 3.254 | 3.299 | 3.373 | 3.447 | 3.492 | 3.566 |
Numerical data
The following are the details of the technical indicators and moving averages that were collected to generate this technical analysis:
| RSI (14): | 52.57 | |
| MACD (12,26,9): | -0.0020 | |
| Directional Movement: | -3.274 | |
| AROON (14): | -64.286 | |
| DEMA (21): | 3.434 | |
| Parabolic SAR (0,02-0,02-0,2): | 3.447 | |
| Elder Ray (13): | 0.006 | |
| Super Trend (3,10): | 3.417 | |
| Zig ZAG (10): | 3.443 | |
| VORTEX (21): | 0.9820 | |
| Stochastique (14,3,5): | 62.77 | |
| TEMA (21): | 3.436 | |
| Williams %R (14): | -25.64 | |
| Chande Momentum Oscillator (20): | -0.005 | |
| Repulse (5,40,3): | 0.1170 | |
| ROCnROLL: | -1 | |
| TRIX (15,9): | -0.0180 | |
| Courbe Coppock: | 0.17 |
| MA7: | 3.453 | |
| MA20: | 3.422 | |
| MA50: | 3.357 | |
| MA100: | 3.258 | |
| MAexp7: | 3.438 | |
| MAexp20: | 3.438 | |
| MAexp50: | 3.443 | |
| MAexp100: | 3.436 | |
| Price / MA7: | -0.38% | |
| Price / MA20: | +0.53% | |
| Price / MA50: | +2.47% | |
| Price / MA100: | +5.59% | |
| Price / MAexp7: | +0.06% | |
| Price / MAexp20: | +0.06% | |
| Price / MAexp50: | -0.09% | |
| Price / MAexp100: | +0.12% |
News
Don't forget to follow the news on KPN KON. At the time of publication of this analysis, the latest news was as follows:
- KPN reports on progress of € 200m share buyback
- KPN reports on progress of € 200m share buyback
- KPN reports on progress of € 200m share buyback
- KPN reports on progress of € 200m share buyback
- Q1 2024 results: KPN delivers solid start to the year
About author
Online


Add a comment
Comments
0 comments on the analysis KPN KON - 1H