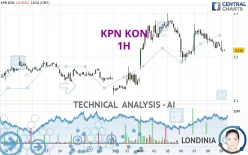
KPN KON - 1H - Technical analysis published on 02/09/2024 (GMT)
- 164
- 0
- Timeframe : 1H
- - Analysis generated on
- Status : NEUTRAL

Summary of the analysis

Additional analysis
Quotes
KPN KON rating 3.214 EUR. The price registered a decrease of -0.34% on the session and was traded between 3.210 EUR and 3.237 EUR over the period. The price is currently at +0.12% from its lowest and -0.71% from its highest.A bearish opening was detected by the Central Gaps scanner. Sellers are trying to impose a bearish trend in the very short term.
Bearish opening
Type : Bearish
Timeframe : Openning
A study of price movements over other periods shows the following variations:
Near a new HIGH record (5 years)
Type : Bullish
Timeframe : Weekly
Near a new HIGH record (1 year)
Type : Bullish
Timeframe : Weekly
Near a new LOW record (1st january)
Type : Bearish
Timeframe : Weekly
Near a new LOW record (1 month)
Type : Bearish
Timeframe : Weekly
Technical
A technical analysis in 1H of this KPN KON chart shows a neutral trend. This indecision could turn into a bearish trend due to the slightly bearish signals currently given by short-term moving averages. An assessment of moving averages reveals a bearish signal that could impact this trend:
Bearish price crossover with adaptative moving average 100
Type : Bearish
Timeframe : 1 hour
In fact, 14 technical indicators on 18 studied are currently bearish. Caution: the Central Indicators scanner currently detects an excess:
CCI indicator is oversold : under -100
Type : Neutral
Timeframe : 1 hour
Williams %R indicator is oversold : under -80
Type : Neutral
Timeframe : 1 hour
Price is back under the pivot point
Type : Bearish
Timeframe : Weekly
The Central Patterns scanner, which studies chart patterns, resistances and supports, has identified this signal:
Near support of channel
Type : Bullish
Timeframe : 1 hour
No result was found by the Central Candlesticks scanner on Japanese candlesticks.
| S3 | S2 | S1 | Price | R1 | R2 | R3 | |
|---|---|---|---|---|---|---|---|
| ProTrendLines | 3.146 | 3.163 | 3.188 | 3.214 | 3.216 | 3.244 | 3.265 |
| Change (%) | -2.12% | -1.59% | -0.81% | - | +0.06% | +0.93% | +1.59% |
| Change | -0.068 | -0.051 | -0.026 | - | +0.002 | +0.030 | +0.051 |
| Level | Minor | Minor | Intermediate | - | Major | Minor | Major |
To determine price objectives, it is also possible to use the pivot points. Here is the price position in relation to pivot points:
| Pivot points | S3 | S2 | S1 | PP | R1 | R2 | R3 |
|---|---|---|---|---|---|---|---|
| Standard | 3.180 | 3.200 | 3.212 | 3.232 | 3.244 | 3.264 | 3.276 |
| Camarilla | 3.216 | 3.219 | 3.222 | 3.225 | 3.228 | 3.231 | 3.234 |
| Woodie | 3.177 | 3.198 | 3.209 | 3.230 | 3.241 | 3.262 | 3.273 |
| Fibonacci | 3.200 | 3.212 | 3.219 | 3.232 | 3.244 | 3.251 | 3.264 |
| Pivot points | S3 | S2 | S1 | PP | R1 | R2 | R3 |
|---|---|---|---|---|---|---|---|
| Standard | 2.986 | 3.049 | 3.158 | 3.221 | 3.330 | 3.393 | 3.502 |
| Camarilla | 3.220 | 3.236 | 3.251 | 3.267 | 3.283 | 3.299 | 3.314 |
| Woodie | 3.009 | 3.061 | 3.181 | 3.233 | 3.353 | 3.405 | 3.525 |
| Fibonacci | 3.049 | 3.115 | 3.155 | 3.221 | 3.287 | 3.327 | 3.393 |
| Pivot points | S3 | S2 | S1 | PP | R1 | R2 | R3 |
|---|---|---|---|---|---|---|---|
| Standard | 3.014 | 3.061 | 3.105 | 3.152 | 3.196 | 3.243 | 3.287 |
| Camarilla | 3.123 | 3.131 | 3.140 | 3.148 | 3.156 | 3.165 | 3.173 |
| Woodie | 3.012 | 3.060 | 3.103 | 3.151 | 3.194 | 3.242 | 3.285 |
| Fibonacci | 3.061 | 3.096 | 3.118 | 3.152 | 3.187 | 3.209 | 3.243 |
Numerical data
The following is the status of the technical indicators and moving averages at the time of publication of this technical analysis:
| RSI (14): | 40.14 | |
| MACD (12,26,9): | -0.0050 | |
| Directional Movement: | -13.182 | |
| AROON (14): | -100.000 | |
| DEMA (21): | 3.228 | |
| Parabolic SAR (0,02-0,02-0,2): | 3.269 | |
| Elder Ray (13): | -0.016 | |
| Super Trend (3,10): | 3.206 | |
| Zig ZAG (10): | 3.215 | |
| VORTEX (21): | 1.0090 | |
| Stochastique (14,3,5): | 9.04 | |
| TEMA (21): | 3.220 | |
| Williams %R (14): | -90.91 | |
| Chande Momentum Oscillator (20): | -0.028 | |
| Repulse (5,40,3): | -0.4250 | |
| ROCnROLL: | 2 | |
| TRIX (15,9): | -0.0070 | |
| Courbe Coppock: | 1.50 |
| MA7: | 3.238 | |
| MA20: | 3.187 | |
| MA50: | 3.152 | |
| MA100: | 3.157 | |
| MAexp7: | 3.224 | |
| MAexp20: | 3.232 | |
| MAexp50: | 3.228 | |
| MAexp100: | 3.211 | |
| Price / MA7: | -0.74% | |
| Price / MA20: | +0.85% | |
| Price / MA50: | +1.97% | |
| Price / MA100: | +1.81% | |
| Price / MAexp7: | -0.31% | |
| Price / MAexp20: | -0.56% | |
| Price / MAexp50: | -0.43% | |
| Price / MAexp100: | +0.09% |
News
The last news published on KPN KON at the time of the generation of this analysis was as follows:
- Press Release: KPN delivers continued Group service revenue growth, driven by strong commercial momentum
- Press Release: KPN successfully issues € 600m Senior bond
- Press Release: KPN acquires Youfone’s Dutch activities
- Press Release: KPN acquires Primevest’s fiber network
- Press release: KPN completes € 300m share buyback
About author
Online


Add a comment
Comments
0 comments on the analysis KPN KON - 1H