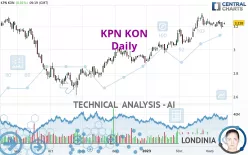
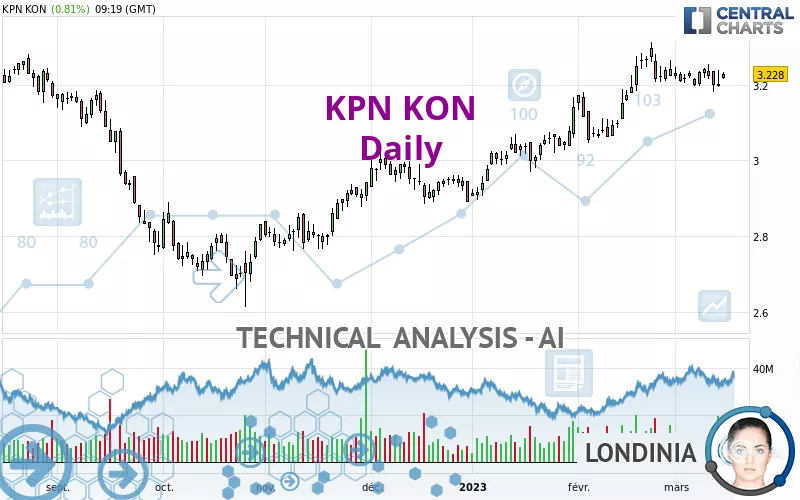
KPN KON - Daily - Technical analysis published on 03/15/2023 (GMT)
- 144
- 0
Click here for a new analysis!
- Timeframe : Daily
- - Analysis generated on
- Status : INVALID
Summary of the analysis

Additional analysis
Quotes
The KPN KON rating is 3.228 EUR. The price registered an increase of +0.81% on the session and was traded between 3.214 EUR and 3.233 EUR over the period. The price is currently at +0.44% from its lowest and -0.15% from its highest.The Central Gaps scanner detects a bullish opening. A small advantage for buyers in the very short term.
Bullish opening
Type : Bullish
Timeframe : Openning
So that you have an overall view of the price change, here is a table showing the variations over several periods:
Near a new HIGH record (1st january)
Type : Bullish
Timeframe : Weekly
Near a new HIGH record (1 month)
Type : Bullish
Timeframe : Weekly
Technical
A technical analysis in Daily of this KPN KON chart shows a strongly bullish trend. 85.71% of the signals given by moving averages are bullish. The slightly bullish signals given by the short-term moving averages show a weakening of the global trend. The Central Indicators scanner does not detect any result on moving averages that would impact this trend.
In fact, Central Analyzer took into account 18 technical indicators and the result was as follows: 5 are bullish, 7 are neutral and 6 are bearish. Central Indicators, the scanner specialised in technical indicators, has identified these signals:
Price is back under the pivot point
Type : Bearish
Timeframe : Weekly
Williams %R indicator is back over -50
Type : Bullish
Timeframe : Daily
An analysis of the price chart with the Central Patterns scanner (detector of chart patterns and resistances and supports) shows several results that can have an impact on the price change:
Near resistance of channel
Type : Bearish
Timeframe : Daily
Near resistance of triangle
Type : Bearish
Timeframe : Daily
No result was found by the Central Candlesticks scanner on Japanese candlesticks.
| S3 | S2 | S1 | Price | R1 | R2 | |
|---|---|---|---|---|---|---|
| ProTrendLines | 2.890 | 3.006 | 3.173 | 3.228 | 3.297 | 3.419 |
| Change (%) | -10.47% | -6.88% | -1.70% | - | +2.14% | +5.92% |
| Change | -0.338 | -0.222 | -0.055 | - | +0.069 | +0.191 |
| Level | Intermediate | Major | Major | - | Major | Major |
To determine price objectives, it is also possible to use the pivot points. Here is the price position in relation to pivot points:
| Pivot points | S3 | S2 | S1 | PP | R1 | R2 | R3 |
|---|---|---|---|---|---|---|---|
| Standard | 3.140 | 3.167 | 3.185 | 3.212 | 3.230 | 3.257 | 3.275 |
| Camarilla | 3.190 | 3.194 | 3.198 | 3.202 | 3.206 | 3.210 | 3.214 |
| Woodie | 3.135 | 3.165 | 3.180 | 3.210 | 3.225 | 3.255 | 3.270 |
| Fibonacci | 3.167 | 3.185 | 3.195 | 3.212 | 3.230 | 3.240 | 3.257 |
| Pivot points | S3 | S2 | S1 | PP | R1 | R2 | R3 |
|---|---|---|---|---|---|---|---|
| Standard | 3.148 | 3.172 | 3.205 | 3.229 | 3.262 | 3.286 | 3.319 |
| Camarilla | 3.221 | 3.227 | 3.232 | 3.237 | 3.242 | 3.248 | 3.253 |
| Woodie | 3.152 | 3.174 | 3.209 | 3.231 | 3.266 | 3.288 | 3.323 |
| Fibonacci | 3.172 | 3.194 | 3.208 | 3.229 | 3.251 | 3.265 | 3.286 |
| Pivot points | S3 | S2 | S1 | PP | R1 | R2 | R3 |
|---|---|---|---|---|---|---|---|
| Standard | 2.818 | 2.932 | 3.086 | 3.200 | 3.354 | 3.468 | 3.622 |
| Camarilla | 3.167 | 3.192 | 3.216 | 3.241 | 3.266 | 3.290 | 3.315 |
| Woodie | 2.839 | 2.942 | 3.107 | 3.210 | 3.375 | 3.478 | 3.643 |
| Fibonacci | 2.932 | 3.034 | 3.097 | 3.200 | 3.302 | 3.365 | 3.468 |
Numerical data
The following is the status of technical indicators and moving averages registered at the time this technical analysis was created:
| RSI (14): | 57.04 | |
| MACD (12,26,9): | 0.0260 | |
| Directional Movement: | 5.592 | |
| AROON (14): | -85.714 | |
| DEMA (21): | 3.247 | |
| Parabolic SAR (0,02-0,02-0,2): | 3.252 | |
| Elder Ray (13): | 0.006 | |
| Super Trend (3,10): | 3.140 | |
| Zig ZAG (10): | 3.229 | |
| VORTEX (21): | 1.0640 | |
| Stochastique (14,3,5): | 31.34 | |
| TEMA (21): | 3.233 | |
| Williams %R (14): | -43.02 | |
| Chande Momentum Oscillator (20): | -0.010 | |
| Repulse (5,40,3): | -0.0820 | |
| ROCnROLL: | 1 | |
| TRIX (15,9): | 0.1660 | |
| Courbe Coppock: | 0.93 |
| MA7: | 3.220 | |
| MA20: | 3.230 | |
| MA50: | 3.129 | |
| MA100: | 3.007 | |
| MAexp7: | 3.220 | |
| MAexp20: | 3.206 | |
| MAexp50: | 3.138 | |
| MAexp100: | 3.079 | |
| Price / MA7: | +0.25% | |
| Price / MA20: | -0.06% | |
| Price / MA50: | +3.16% | |
| Price / MA100: | +7.35% | |
| Price / MAexp7: | +0.25% | |
| Price / MAexp20: | +0.69% | |
| Price / MAexp50: | +2.87% | |
| Price / MAexp100: | +4.84% |
News
The last news published on KPN KON at the time of the generation of this analysis was as follows:
- Press Release: KPN reports on progress of € 300m share buyback
- Press release: KPN reports on progress of 300m share buyback
- Press Release: Publication of KPN's AGM agenda
- Press release: KPN reports on progress of € 300m share buyback
- Press Release: Publication of KPN Annual Report 2022
About author
Online


Add a comment
Comments
0 comments on the analysis KPN KON - Daily