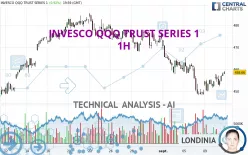
INVESCO QQQ TRUST SERIES 1 - 1H - Technical analysis published on 09/10/2024 (GMT)
- 135
- 0
Click here for a new analysis!
- Timeframe : 1H
- - Analysis generated on
- Status : INVALID

Summary of the analysis

Additional analysis
Quotes
The INVESCO QQQ TRUST SERIES 1 rating is 458.66 USD. The price registered an increase of +0.92% on the session and was traded between 452.23 USD and 459.17 USD over the period. The price is currently at +1.42% from its lowest and -0.11% from its highest.The Central Gaps scanner detects the formation of a bullish gap marking the strong presence of buyers against sellers at the opening. This formed a quotation gap.
Opening Gap UP
Type : Bullish
Timeframe : Openning
Here is a more detailed summary of the historical variations registered by INVESCO QQQ TRUST SERIES 1:
Near a new LOW record (1 month)
Type : Bearish
Timeframe : Weekly
Technical
Technical analysis of this 1H chart of INVESCO QQQ TRUST SERIES 1 indicates that the overall trend is bearish. 71.43% of the signals given by moving averages are bearish. Caution: as the signals currently given by short-term moving averages are rather neutral, the bearish trend could slow down. The Central Indicators scanner does not detect any result on moving averages that would impact this trend.
The technical indicators are bullish. There is still some doubt about the price increase.
Caution: the Central Indicators scanner currently detects an excess:
CCI indicator is overbought : over 100
Type : Neutral
Timeframe : 1 hour
Williams %R indicator is overbought : over -20
Type : Neutral
Timeframe : 1 hour
Pivot points : price is over resistance 1
Type : Neutral
Timeframe : 1 hour
SuperTrend indicator bullish reversal
Type : Bullish
Timeframe : 1 hour
Price is back over the pivot point
Type : Bullish
Timeframe : Weekly
Central Patterns, the scanner specializing in chart patterns, did not identify any signals.
The Central Candlesticks scanner, specialised in Japanese candlesticks, did not identify any signals.
| S3 | S2 | S1 | Price | R1 | R2 | R3 | |
|---|---|---|---|---|---|---|---|
| ProTrendLines | 434.37 | 445.66 | 457.95 | 458.66 | 465.24 | 482.48 | 502.96 |
| Change (%) | -5.30% | -2.83% | -0.15% | - | +1.43% | +5.19% | +9.66% |
| Change | -24.29 | -13.00 | -0.71 | - | +6.58 | +23.82 | +44.30 |
| Level | Minor | Major | Minor | - | Intermediate | Major | Major |
To determine price objectives, it is also possible to use the pivot points. Here is the price position in relation to pivot points:
| Pivot points | S3 | S2 | S1 | PP | R1 | R2 | R3 |
|---|---|---|---|---|---|---|---|
| Standard | 447.26 | 449.75 | 454.20 | 456.69 | 461.14 | 463.63 | 468.08 |
| Camarilla | 456.75 | 457.39 | 458.02 | 458.66 | 459.30 | 459.93 | 460.57 |
| Woodie | 448.25 | 450.24 | 455.19 | 457.18 | 462.13 | 464.12 | 469.07 |
| Fibonacci | 449.75 | 452.40 | 454.04 | 456.69 | 459.34 | 460.98 | 463.63 |
| Pivot points | S3 | S2 | S1 | PP | R1 | R2 | R3 |
|---|---|---|---|---|---|---|---|
| Standard | 415.00 | 431.60 | 440.14 | 456.74 | 465.28 | 481.88 | 490.42 |
| Camarilla | 441.78 | 444.08 | 446.39 | 448.69 | 451.00 | 453.30 | 455.60 |
| Woodie | 410.98 | 429.59 | 436.12 | 454.73 | 461.26 | 479.87 | 486.40 |
| Fibonacci | 431.60 | 441.20 | 447.13 | 456.74 | 466.34 | 472.27 | 481.88 |
| Pivot points | S3 | S2 | S1 | PP | R1 | R2 | R3 |
|---|---|---|---|---|---|---|---|
| Standard | 375.88 | 399.66 | 437.97 | 461.75 | 500.06 | 523.84 | 562.15 |
| Camarilla | 459.20 | 464.89 | 470.58 | 476.27 | 481.96 | 487.65 | 493.35 |
| Woodie | 383.14 | 403.29 | 445.23 | 465.38 | 507.32 | 527.47 | 569.41 |
| Fibonacci | 399.66 | 423.38 | 438.04 | 461.75 | 485.47 | 500.13 | 523.84 |
Numerical data
The following are the details of the technical indicators and moving averages that were collected to generate this technical analysis:
| RSI (14): | 54.73 | |
| MACD (12,26,9): | -0.7200 | |
| Directional Movement: | 3.39 | |
| AROON (14): | 100.00 | |
| DEMA (21): | 453.98 | |
| Parabolic SAR (0,02-0,02-0,2): | 450.80 | |
| Elder Ray (13): | 2.93 | |
| Super Trend (3,10): | 449.89 | |
| Zig ZAG (10): | 458.67 | |
| VORTEX (21): | 0.9100 | |
| Stochastique (14,3,5): | 93.41 | |
| TEMA (21): | 456.11 | |
| Williams %R (14): | -5.35 | |
| Chande Momentum Oscillator (20): | 8.33 | |
| Repulse (5,40,3): | 0.5400 | |
| ROCnROLL: | -1 | |
| TRIX (15,9): | -0.0600 | |
| Courbe Coppock: | 2.29 |
| MA7: | 460.22 | |
| MA20: | 469.46 | |
| MA50: | 471.34 | |
| MA100: | 461.72 | |
| MAexp7: | 456.38 | |
| MAexp20: | 455.68 | |
| MAexp50: | 459.72 | |
| MAexp100: | 463.75 | |
| Price / MA7: | -0.34% | |
| Price / MA20: | -2.30% | |
| Price / MA50: | -2.69% | |
| Price / MA100: | -0.66% | |
| Price / MAexp7: | +0.50% | |
| Price / MAexp20: | +0.66% | |
| Price / MAexp50: | -0.23% | |
| Price / MAexp100: | -1.10% |
About author

Online


Add a comment
Comments
0 comments on the analysis INVESCO QQQ TRUST SERIES 1 - 1H