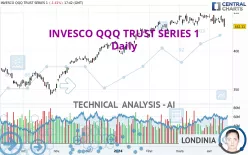
INVESCO QQQ TRUST SERIES 1 - Daily - Technical analysis published on 04/15/2024 (GMT)
- 1026
- 0
Click here for a new analysis!
- Timeframe : Daily
- - Analysis generated on
- Status : LEVEL MAINTAINED

Summary of the analysis

Additional analysis
Quotes
The INVESCO QQQ TRUST SERIES 1 price is 432.11 USD. The price registered a decrease of -1.41% on the session and was traded between 431.28 USD and 442.15 USD over the period. The price is currently at +0.19% from its lowest and -2.27% from its highest.A bullish opening was detected by the Central Gaps scanner. Buyers are trying to impose a bullish momentum in the very short term.
Bullish opening
Type : Bullish
Timeframe : Openning
So that you have an overall view of the price change, here is a table showing the variations over several periods:
Near a new HIGH record (5 years)
Type : Bullish
Timeframe : Weekly
Near a new HIGH record (1 year)
Type : Bullish
Timeframe : Weekly
Near a new HIGH record (1st january)
Type : Bullish
Timeframe : Weekly
Near a new HIGH record (1 month)
Type : Bullish
Timeframe : Weekly
Technical
A technical analysis in Daily of this INVESCO QQQ TRUST SERIES 1 chart shows a bullish trend. The signals given by moving averages are 67.86% bullish. This bullish trend could slow down given the slightly bearish signals currently being given by short-term moving averages. The Central Indicators scanner detects bearish signals on moving averages that could impact this trend:
Bearish price crossover with Moving Average 50
Type : Bearish
Timeframe : Daily
Bearish price crossover with adaptative moving average 50
Type : Bearish
Timeframe : Daily
Bearish price crossover with adaptative moving average 100
Type : Bearish
Timeframe : Daily
An assessment of technical indicators shows a slightly bearish signal.
Caution: the Central Indicators scanner currently detects an excess:
CCI indicator is oversold : under -100
Type : Neutral
Timeframe : Daily
Williams %R indicator is oversold : under -80
Type : Neutral
Timeframe : Daily
Pivot points : price is under support 1
Type : Neutral
Timeframe : Daily
Parabolic SAR indicator bearish reversal
Type : Bearish
Timeframe : Daily
Price is back under the pivot point
Type : Bearish
Timeframe : Weekly
The analysis of the price chart with Central Patterns scanners does not return any result.
No result was found by the Central Candlesticks scanner on Japanese candlesticks.
| S3 | S2 | S1 | Price | R1 | R2 | |
|---|---|---|---|---|---|---|
| ProTrendLines | 383.63 | 397.20 | 410.95 | 432.11 | 433.34 | 446.38 |
| Change (%) | -11.22% | -8.08% | -4.90% | - | +0.28% | +3.30% |
| Change | -48.48 | -34.91 | -21.16 | - | +1.23 | +14.27 |
| Level | Intermediate | Major | Minor | - | Major | Major |
Attention could also be paid to pivot points to set price objectives:
| Pivot points | S3 | S2 | S1 | PP | R1 | R2 | R3 |
|---|---|---|---|---|---|---|---|
| Standard | 430.66 | 433.77 | 436.02 | 439.13 | 441.38 | 444.49 | 446.74 |
| Camarilla | 436.80 | 437.29 | 437.78 | 438.27 | 438.76 | 439.25 | 439.74 |
| Woodie | 430.23 | 433.56 | 435.59 | 438.92 | 440.95 | 444.28 | 446.31 |
| Fibonacci | 433.77 | 435.82 | 437.08 | 439.13 | 441.18 | 442.44 | 444.49 |
| Pivot points | S3 | S2 | S1 | PP | R1 | R2 | R3 |
|---|---|---|---|---|---|---|---|
| Standard | 424.21 | 430.24 | 434.26 | 440.29 | 444.31 | 450.34 | 454.36 |
| Camarilla | 435.51 | 436.43 | 437.35 | 438.27 | 439.19 | 440.11 | 441.03 |
| Woodie | 423.20 | 429.74 | 433.25 | 439.79 | 443.30 | 449.84 | 453.35 |
| Fibonacci | 430.24 | 434.08 | 436.45 | 440.29 | 444.13 | 446.50 | 450.34 |
| Pivot points | S3 | S2 | S1 | PP | R1 | R2 | R3 |
|---|---|---|---|---|---|---|---|
| Standard | 417.15 | 424.66 | 434.33 | 441.84 | 451.51 | 459.02 | 468.69 |
| Camarilla | 439.29 | 440.86 | 442.44 | 444.01 | 445.59 | 447.16 | 448.74 |
| Woodie | 418.24 | 425.20 | 435.42 | 442.38 | 452.60 | 459.56 | 469.78 |
| Fibonacci | 424.66 | 431.22 | 435.27 | 441.84 | 448.40 | 452.45 | 459.02 |
Numerical data
The following is the status of technical indicators and moving averages registered at the time this technical analysis was created:
| RSI (14): | 46.21 | |
| MACD (12,26,9): | 0.5800 | |
| Directional Movement: | 1.11 | |
| AROON (14): | -71.43 | |
| DEMA (21): | 441.47 | |
| Parabolic SAR (0,02-0,02-0,2): | 449.34 | |
| Elder Ray (13): | -1.84 | |
| Super Trend (3,10): | 430.37 | |
| Zig ZAG (10): | 434.38 | |
| VORTEX (21): | 0.8700 | |
| Stochastique (14,3,5): | 36.47 | |
| TEMA (21): | 438.83 | |
| Williams %R (14): | -98.79 | |
| Chande Momentum Oscillator (20): | -10.48 | |
| Repulse (5,40,3): | -2.0800 | |
| ROCnROLL: | -1 | |
| TRIX (15,9): | 0.0500 | |
| Courbe Coppock: | 1.68 |
| MA7: | 439.74 | |
| MA20: | 441.71 | |
| MA50: | 437.71 | |
| MA100: | 420.68 | |
| MAexp7: | 438.87 | |
| MAexp20: | 440.33 | |
| MAexp50: | 434.72 | |
| MAexp100: | 420.73 | |
| Price / MA7: | -1.74% | |
| Price / MA20: | -2.17% | |
| Price / MA50: | -1.28% | |
| Price / MA100: | +2.72% | |
| Price / MAexp7: | -1.54% | |
| Price / MAexp20: | -1.87% | |
| Price / MAexp50: | -0.60% | |
| Price / MAexp100: | +2.70% |
About author

Online


Add a comment
Comments
0 comments on the analysis INVESCO QQQ TRUST SERIES 1 - Daily