EQUASENS - Daily - Technical analysis published on 10/05/2019 (GMT)
- 361
- 0
- Who voted?
Click here for a new analysis!
- Timeframe : Daily
- - Analysis generated on
- Status : TARGET REACHED

Summary of the analysis

Additional analysis
Quotes
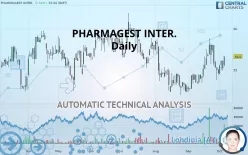
The PHARMAGEST INTER. price is 56.6 EUR. The price registered an increase of +2.54% on the session and was between 55.4 EUR and 56.6 EUR. This implies that the price is at +2.17% from its lowest and at 0% from its highest.The Central Gaps scanner detects a bullish opening. A small advantage for buyers in the very short term.
Bullish opening
Type : Bullish
Timeframe : Openning
So that you have an overall view of the price change, here is a table showing the variations over several periods:
Near a new HIGH record (1 month)
Type : Bullish
Timeframe : Weekly
Technical
A technical analysis in Daily of this PHARMAGEST INTER. chart shows a bullish trend. 71.43% of the signals given by moving averages are bullish. The overall trend is reinforced by the strong bullish signals from short-term moving averages. The Central Indicators market scanner is currently detecting several bearish signals that could impact this trend:
Bearish price crossover with Moving Average 20
Type : Bearish
Timeframe : Daily
Bearish price crossover with adaptative moving average 100
Type : Bearish
Timeframe : Daily
In fact, 12 technical indicators on 18 studied are currently positioned bullish. Caution: the Central Indicators scanner currently detects an excess:
Williams %R indicator is overbought : over -20
Type : Neutral
Timeframe : Daily
Pivot points : price is over resistance 2
Type : Neutral
Timeframe : Daily
RSI indicator is back under 50
Type : Bearish
Timeframe : Daily
Price is back under the pivot point
Type : Bearish
Timeframe : Daily
Price is back under the pivot point
Type : Bearish
Timeframe : Weekly
Momentum indicator is back under 0
Type : Bearish
Timeframe : Daily
The analysis of the price chart with Central Patterns scanners does not return any result.
No result was found by the Central Candlesticks scanner on Japanese candlesticks.
| S3 | S2 | S1 | Price | R1 | R2 | R3 | |
|---|---|---|---|---|---|---|---|
| ProTrendLines | 53.8 | 54.8 | 56.3 | 56.6 | 58.0 | 59.1 | 60.8 |
| Change (%) | -4.95% | -3.13% | -0.58% | - | +2.42% | +4.36% | +7.42% |
| Change | -2.8 | -1.8 | -0.3 | - | +1.4 | +2.5 | +4.2 |
| Level | Major | Major | Intermediate | - | Major | Major | Minor |
Attention could also be paid to pivot points to set price objectives:
| Pivot points | S3 | S2 | S1 | PP | R1 | R2 | R3 |
|---|---|---|---|---|---|---|---|
| Standard | 53.5 | 54.2 | 54.7 | 55.4 | 55.9 | 56.6 | 57.1 |
| Camarilla | 54.9 | 55.0 | 55.1 | 55.2 | 55.3 | 55.4 | 55.5 |
| Woodie | 53.4 | 54.2 | 54.6 | 55.4 | 55.8 | 56.6 | 57.0 |
| Fibonacci | 54.2 | 54.7 | 54.9 | 55.4 | 55.9 | 56.1 | 56.6 |
| Pivot points | S3 | S2 | S1 | PP | R1 | R2 | R3 |
|---|---|---|---|---|---|---|---|
| Standard | 48.7 | 51.3 | 53.1 | 55.7 | 57.5 | 60.1 | 61.9 |
| Camarilla | 53.8 | 54.2 | 54.6 | 55.0 | 55.4 | 55.8 | 56.2 |
| Woodie | 48.4 | 51.1 | 52.8 | 55.5 | 57.2 | 59.9 | 61.6 |
| Fibonacci | 51.3 | 52.9 | 54.0 | 55.7 | 57.3 | 58.4 | 60.1 |
| Pivot points | S3 | S2 | S1 | PP | R1 | R2 | R3 |
|---|---|---|---|---|---|---|---|
| Standard | 45.2 | 48.7 | 51.7 | 55.2 | 58.2 | 61.7 | 64.7 |
| Camarilla | 52.8 | 53.4 | 54.0 | 54.6 | 55.2 | 55.8 | 56.4 |
| Woodie | 44.9 | 48.6 | 51.4 | 55.1 | 57.9 | 61.6 | 64.4 |
| Fibonacci | 48.7 | 51.2 | 52.8 | 55.2 | 57.7 | 59.3 | 61.7 |
Numerical data
The following is the status of technical indicators and moving averages registered at the time this technical analysis was created:
| RSI (14): | 55.98 | |
| MACD (12,26,9): | 0.3300 | |
| Directional Movement: | 3.1 | |
| AROON (14): | -35.7 | |
| DEMA (21): | 55.9 | |
| Parabolic SAR (0,02-0,02-0,2): | 57.8 | |
| Elder Ray (13): | 0.3 | |
| Super Trend (3,10): | 54.4 | |
| Zig ZAG (10): | 56.6 | |
| VORTEX (21): | 1.0500 | |
| Stochastique (14,3,5): | 44.67 | |
| TEMA (21): | 56.3 | |
| Williams %R (14): | -44.00 | |
| Chande Momentum Oscillator (20): | 0.2 | |
| Repulse (5,40,3): | 2.4900 | |
| ROCnROLL: | 1 | |
| TRIX (15,9): | 0.1000 | |
| Courbe Coppock: | 3.67 |
| MA7: | 55.5 | |
| MA20: | 55.5 | |
| MA50: | 54.9 | |
| MA100: | 56.2 | |
| MAexp7: | 55.8 | |
| MAexp20: | 55.5 | |
| MAexp50: | 55.4 | |
| MAexp100: | 55.6 | |
| Price / MA7: | +2.04% | |
| Price / MA20: | +1.96% | |
| Price / MA50: | +3.12% | |
| Price / MA100: | +0.80% | |
| Price / MAexp7: | +1.40% | |
| Price / MAexp20: | +1.98% | |
| Price / MAexp50: | +2.20% | |
| Price / MAexp100: | +1.82% |
News
The last news published on PHARMAGEST INTER. at the time of the generation of this analysis was as follows:
- Pharmagest Interactive: new acquisition in Italy
- Pharmagest Interactive: H1 2019 Results
- Pharmagest Interactive: Annual General Meeting of June 27, 2019 - Notice of meeting
- Pharmagest Interactive: Closing of the acquisition of the equity stake in the Italian company, Pharmathek
- Pharmagest Interactive: Annual Ordinary General meeting June 27, 2019 - Preliminary notice
About author

Online


Add a comment
Comments
0 comments on the analysis EQUASENS - Daily