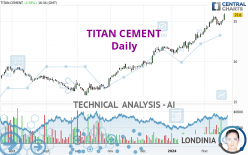
TITAN CEMENT - Daily - Technical analysis published on 02/21/2024 (GMT)
- 77
- 0
Click here for a new analysis!
- Timeframe : Daily
- - Analysis generated on
- Status : LEVEL MAINTAINED

Summary of the analysis

Additional analysis
Quotes
TITAN CEMENT rating 25.80 EUR. The price has increased by +2.58% since the last closing with the lowest point at 25.10 EUR and the highest point at 26.00 EUR. The deviation from the price is +2.79% for the low point and -0.77% for the high point.A bullish opening was detected by the Central Gaps scanner. Buyers are trying to impose a bullish momentum in the very short term.
Bullish opening
Type : Bullish
Timeframe : Openning
A study of price movements over other periods shows the following variations:
New HIGH record (5 years)
Type : Bullish
Timeframe : Weekly
New HIGH record (1 year)
Type : Bullish
Timeframe : Weekly
New HIGH record (1st january)
Type : Bullish
Timeframe : Weekly
New HIGH record (1 month)
Type : Bullish
Timeframe : Weekly
Technical
Technical analysis of TITAN CEMENT in Daily shows a strongly overall bullish trend. 92.86% of the signals given by moving averages are bullish. This strongly bullish trend is supported by the strong bullish signals given by short-term moving averages. The Central Indicators market scanner currently does not detect any result that concerns moving averages.
In fact, 14 technical indicators on 18 studied are currently positioned bullish. Caution: the Central Indicators scanner currently detects an excess:
RSI indicator is overbought : over 70
Type : Neutral
Timeframe : Daily
CCI indicator is overbought : over 100
Type : Neutral
Timeframe : Daily
Williams %R indicator is overbought : over -20
Type : Neutral
Timeframe : Daily
Pivot points : price is over resistance 1
Type : Neutral
Timeframe : Weekly
Pivot points : price is over resistance 3
Type : Neutral
Timeframe : Daily
Parabolic SAR indicator bullish reversal
Type : Bullish
Timeframe : Daily
An analysis of the price chart with the Central Patterns scanner (detector of chart patterns and resistances and supports) shows a result that can have an impact on the price change:
Near horizontal support
Type : Bullish
Timeframe : Daily
The Central Candlesticks scanner which studies Japanese candlesticks did not detect anything.
| S3 | S2 | S1 | Price | |
|---|---|---|---|---|
| ProTrendLines | 19.34 | 21.70 | 25.45 | 25.80 |
| Change (%) | -25.04% | -15.89% | -1.36% | - |
| Change | -6.46 | -4.10 | -0.35 | - |
| Level | Major | Minor | Major | - |
To determine price objectives, it is also possible to use the pivot points. Here is the price position in relation to pivot points:
| Pivot points | S3 | S2 | S1 | PP | R1 | R2 | R3 |
|---|---|---|---|---|---|---|---|
| Standard | 24.37 | 24.73 | 25.27 | 25.63 | 26.17 | 26.53 | 27.07 |
| Camarilla | 25.55 | 25.64 | 25.72 | 25.80 | 25.88 | 25.97 | 26.05 |
| Woodie | 24.45 | 24.78 | 25.35 | 25.68 | 26.25 | 26.58 | 27.15 |
| Fibonacci | 24.73 | 25.08 | 25.29 | 25.63 | 25.98 | 26.19 | 26.53 |
| Pivot points | S3 | S2 | S1 | PP | R1 | R2 | R3 |
|---|---|---|---|---|---|---|---|
| Standard | 23.37 | 23.93 | 24.47 | 25.03 | 25.57 | 26.13 | 26.67 |
| Camarilla | 24.70 | 24.80 | 24.90 | 25.00 | 25.10 | 25.20 | 25.30 |
| Woodie | 23.35 | 23.93 | 24.45 | 25.03 | 25.55 | 26.13 | 26.65 |
| Fibonacci | 23.93 | 24.35 | 24.61 | 25.03 | 25.45 | 25.71 | 26.13 |
| Pivot points | S3 | S2 | S1 | PP | R1 | R2 | R3 |
|---|---|---|---|---|---|---|---|
| Standard | 18.78 | 19.82 | 21.73 | 22.77 | 24.68 | 25.72 | 27.63 |
| Camarilla | 22.84 | 23.11 | 23.38 | 23.65 | 23.92 | 24.19 | 24.46 |
| Woodie | 19.23 | 20.04 | 22.18 | 22.99 | 25.13 | 25.94 | 28.08 |
| Fibonacci | 19.82 | 20.94 | 21.64 | 22.77 | 23.89 | 24.59 | 25.72 |
Numerical data
The following is the status of the technical indicators and moving averages at the time of publication of this technical analysis:
| RSI (14): | 73.09 | |
| MACD (12,26,9): | 0.8100 | |
| Directional Movement: | 32.10 | |
| AROON (14): | 100.00 | |
| DEMA (21): | 25.44 | |
| Parabolic SAR (0,02-0,02-0,2): | 24.50 | |
| Elder Ray (13): | 0.79 | |
| Super Trend (3,10): | 23.93 | |
| Zig ZAG (10): | 25.80 | |
| VORTEX (21): | 1.2500 | |
| Stochastique (14,3,5): | 80.56 | |
| TEMA (21): | 25.54 | |
| Williams %R (14): | -8.33 | |
| Chande Momentum Oscillator (20): | 1.80 | |
| Repulse (5,40,3): | 3.8100 | |
| ROCnROLL: | 1 | |
| TRIX (15,9): | 0.5200 | |
| Courbe Coppock: | 14.31 |
| MA7: | 25.01 | |
| MA20: | 24.37 | |
| MA50: | 22.71 | |
| MA100: | 20.39 | |
| MAexp7: | 25.10 | |
| MAexp20: | 24.35 | |
| MAexp50: | 22.85 | |
| MAexp100: | 21.19 | |
| Price / MA7: | +3.16% | |
| Price / MA20: | +5.87% | |
| Price / MA50: | +13.61% | |
| Price / MA100: | +26.53% | |
| Price / MAexp7: | +2.79% | |
| Price / MAexp20: | +5.95% | |
| Price / MAexp50: | +12.91% | |
| Price / MAexp100: | +21.76% |
About author
Online


Add a comment
Comments
0 comments on the analysis TITAN CEMENT - Daily