AMPLEFORTH - AMPL/USD - 1H - Technical analysis published on 11/10/2024 (GMT)
- 107
- 0
Click here for a new analysis!
- Timeframe : 1H
- - Analysis generated on
- Status : INVALID

Summary of the analysis

Additional analysis
Quotes
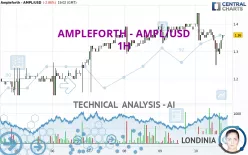
The AMPLEFORTH - AMPL/USD rating is 1.36 USD. The price is lower by -2.86% since the last closing and was traded between 1.25 USD and 1.44 USD over the period. The price is currently at +8.80% from its lowest and -5.56% from its highest.The Central Gaps scanner detects a bearish opening. A small advantage for sellers in the very short term.
Bearish opening
Type : Bearish
Timeframe : Openning
Here is a more detailed summary of the historical variations registered by AMPLEFORTH - AMPL/USD:
Near a new HIGH record (1 month)
Type : Bullish
Timeframe : Weekly
Technical
Technical analysis of AMPLEFORTH - AMPL/USD in 1H shows an overall bullish trend. 67.86% of the signals given by moving averages are bullish. Caution: the neutral signals currently given by the short-term moving averages indicate that this bullish trend is showing signs of running out of steam. The Central Indicators market scanner is currently detecting several bullish signals that could impact this trend:
Bullish trend reversal : adaptative moving average 50
Type : Bullish
Timeframe : 1 hour
Bullish price crossover with adaptative moving average 20
Type : Bullish
Timeframe : 1 hour
In fact, 10 technical indicators on 18 studied are currently bullish. But beware of excesses. The Central Indicators scanner currently detects this:
Williams %R indicator is overbought : over -20
Type : Neutral
Timeframe : 1 hour
Pivot points : price is over resistance 1
Type : Neutral
Timeframe : Weekly
MACD crosses UP its Moving Average
Type : Bullish
Timeframe : 1 hour
Central Patterns, the scanner specializing in chart patterns, did not identify any signals.
Central Candlesticks, the scanner specialised in Japanese candlesticks, detects these signals that could have an impact on the current short-term trend:
Upside gap
Type : Bullish
Timeframe : 1 hour
Bearish doji star
Type : Bearish
Timeframe : 1 hour
Doji
Type : Neutral
Timeframe : 1 hour
| S3 | S2 | S1 | Price | R1 | R2 | R3 | |
|---|---|---|---|---|---|---|---|
| ProTrendLines | 1.24 | 1.29 | 1.33 | 1.36 | 1.37 | 1.41 | 1.47 |
| Change (%) | -8.82% | -5.15% | -2.21% | - | +0.74% | +3.68% | +8.09% |
| Change | -0.12 | -0.07 | -0.03 | - | +0.01 | +0.05 | +0.11 |
| Level | Major | Minor | Intermediate | - | Minor | Intermediate | Minor |
Pivot points can also be used to set your price objectives. Here is the price situation in relation to pivot points:
| Pivot points | S3 | S2 | S1 | PP | R1 | R2 | R3 |
|---|---|---|---|---|---|---|---|
| Standard | 1.28 | 1.31 | 1.35 | 1.38 | 1.42 | 1.45 | 1.49 |
| Camarilla | 1.38 | 1.39 | 1.39 | 1.40 | 1.41 | 1.41 | 1.42 |
| Woodie | 1.30 | 1.31 | 1.37 | 1.38 | 1.44 | 1.45 | 1.51 |
| Fibonacci | 1.31 | 1.33 | 1.35 | 1.38 | 1.40 | 1.42 | 1.45 |
| Pivot points | S3 | S2 | S1 | PP | R1 | R2 | R3 |
|---|---|---|---|---|---|---|---|
| Standard | 0.95 | 1.04 | 1.22 | 1.31 | 1.49 | 1.58 | 1.76 |
| Camarilla | 1.33 | 1.35 | 1.38 | 1.40 | 1.43 | 1.45 | 1.47 |
| Woodie | 1.00 | 1.06 | 1.27 | 1.33 | 1.54 | 1.60 | 1.81 |
| Fibonacci | 1.04 | 1.14 | 1.21 | 1.31 | 1.41 | 1.48 | 1.58 |
| Pivot points | S3 | S2 | S1 | PP | R1 | R2 | R3 |
|---|---|---|---|---|---|---|---|
| Standard | 0.40 | 0.69 | 0.91 | 1.20 | 1.42 | 1.71 | 1.93 |
| Camarilla | 0.99 | 1.04 | 1.08 | 1.13 | 1.18 | 1.22 | 1.27 |
| Woodie | 0.37 | 0.67 | 0.88 | 1.18 | 1.39 | 1.69 | 1.90 |
| Fibonacci | 0.69 | 0.89 | 1.01 | 1.20 | 1.40 | 1.52 | 1.71 |
Numerical data
The following is the status of the technical indicators and moving averages at the time of publication of this technical analysis:
| RSI (14): | 50.90 | |
| MACD (12,26,9): | -0.0100 | |
| Directional Movement: | -6.91 | |
| AROON (14): | -28.58 | |
| DEMA (21): | 1.33 | |
| Parabolic SAR (0,02-0,02-0,2): | 1.38 | |
| Elder Ray (13): | 0.02 | |
| Super Trend (3,10): | 1.38 | |
| Zig ZAG (10): | 1.36 | |
| VORTEX (21): | 0.9300 | |
| Stochastique (14,3,5): | 78.44 | |
| TEMA (21): | 1.33 | |
| Williams %R (14): | -14.97 | |
| Chande Momentum Oscillator (20): | 0.00 | |
| Repulse (5,40,3): | 1.9700 | |
| ROCnROLL: | 1 | |
| TRIX (15,9): | -0.1200 | |
| Courbe Coppock: | 5.40 |
| MA7: | 1.31 | |
| MA20: | 1.23 | |
| MA50: | 1.24 | |
| MA100: | 1.14 | |
| MAexp7: | 1.34 | |
| MAexp20: | 1.35 | |
| MAexp50: | 1.35 | |
| MAexp100: | 1.33 | |
| Price / MA7: | +3.82% | |
| Price / MA20: | +10.57% | |
| Price / MA50: | +9.68% | |
| Price / MA100: | +19.30% | |
| Price / MAexp7: | +1.49% | |
| Price / MAexp20: | +0.74% | |
| Price / MAexp50: | +0.74% | |
| Price / MAexp100: | +2.26% |
About author
Online


Add a comment
Comments
0 comments on the analysis AMPLEFORTH - AMPL/USD - 1H