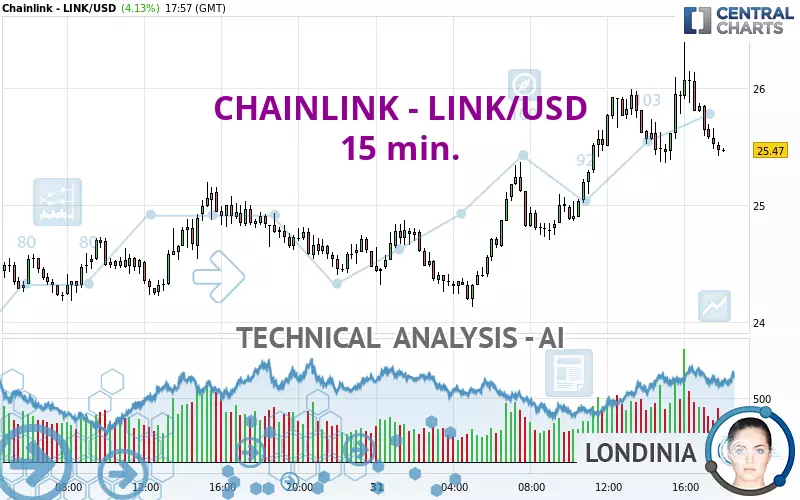
CHAINLINK - LINK/USD - 15 min. - Technical analysis published on 01/31/2025 (GMT)
- 77
- 0
Click here for a new analysis!
- Timeframe : 15 min.
- - Analysis generated on
- Status : LEVEL MAINTAINED

Summary of the analysis

Additional analysis
Quotes
The CHAINLINK - LINK/USD rating is 25.47 USD. The price has increased by +4.13% since the last closing with the lowest point at 24.13 USD and the highest point at 26.39 USD. The deviation from the price is +5.55% for the low point and -3.49% for the high point.Here is a more detailed summary of the historical variations registered by CHAINLINK - LINK/USD:
Near a new HIGH record (1st january)
Type : Bullish
Timeframe : Weekly
Near a new HIGH record (1 month)
Type : Bullish
Timeframe : Weekly
Technical
A technical analysis in 15 min. of this CHAINLINK - LINK/USD chart shows a bullish trend. 78.57% of the signals given by moving averages are bullish. Caution: the neutral signals currently given by the short-term moving averages indicate that this bullish trend is showing signs of running out of steam. The Central Indicators market scanner is currently detecting a bearish signal that could impact this trend:
Bearish price crossover with Moving Average 20
Type : Bearish
Timeframe : 15 minutes
An assessment of technical indicators does not currently provide any relevant information on the direction of future price movements.
Central Indicators, the scanner specialised in technical indicators, has identified these signals:
Pivot points : price is over resistance 1
Type : Neutral
Timeframe : 15 minutes
RSI indicator is back under 50
Type : Bearish
Timeframe : 15 minutes
Parabolic SAR indicator bearish reversal
Type : Bearish
Timeframe : 15 minutes
Price is back over the pivot point
Type : Bullish
Timeframe : Weekly
Momentum indicator is back under 0
Type : Bearish
Timeframe : 15 minutes
The analysis of the price chart with Central Patterns scanners does not return any result.
The Central Candlesticks scanner, specialised in Japanese candlesticks, did not identify any signals.
| S3 | S2 | S1 | Price | R1 | R2 | R3 | |
|---|---|---|---|---|---|---|---|
| ProTrendLines | 24.20 | 24.71 | 25.19 | 25.47 | 25.86 | 26.68 | 29.22 |
| Change (%) | -4.99% | -2.98% | -1.10% | - | +1.53% | +4.75% | +14.72% |
| Change | -1.27 | -0.76 | -0.28 | - | +0.39 | +1.21 | +3.75 |
| Level | Minor | Intermediate | Minor | - | Minor | Major | Major |
To determine price objectives, it is also possible to use the pivot points. Here is the price position in relation to pivot points:
| Pivot points | S3 | S2 | S1 | PP | R1 | R2 | R3 |
|---|---|---|---|---|---|---|---|
| Standard | 21.72 | 22.57 | 23.51 | 24.36 | 25.30 | 26.15 | 27.09 |
| Camarilla | 23.97 | 24.13 | 24.30 | 24.46 | 24.62 | 24.79 | 24.95 |
| Woodie | 21.78 | 22.59 | 23.57 | 24.38 | 25.36 | 26.17 | 27.15 |
| Fibonacci | 22.57 | 23.25 | 23.67 | 24.36 | 25.04 | 25.46 | 26.15 |
| Pivot points | S3 | S2 | S1 | PP | R1 | R2 | R3 |
|---|---|---|---|---|---|---|---|
| Standard | 17.28 | 19.72 | 22.32 | 24.76 | 27.36 | 29.80 | 32.40 |
| Camarilla | 23.53 | 24.00 | 24.46 | 24.92 | 25.38 | 25.84 | 26.31 |
| Woodie | 17.36 | 19.76 | 22.40 | 24.80 | 27.44 | 29.84 | 32.48 |
| Fibonacci | 19.72 | 21.65 | 22.84 | 24.76 | 26.69 | 27.88 | 29.80 |
| Pivot points | S3 | S2 | S1 | PP | R1 | R2 | R3 |
|---|---|---|---|---|---|---|---|
| Standard | 5.06 | 12.42 | 16.20 | 23.56 | 27.34 | 34.70 | 38.48 |
| Camarilla | 16.91 | 17.93 | 18.95 | 19.97 | 20.99 | 22.01 | 23.03 |
| Woodie | 3.26 | 11.53 | 14.40 | 22.67 | 25.54 | 33.81 | 36.68 |
| Fibonacci | 12.42 | 16.68 | 19.31 | 23.56 | 27.82 | 30.45 | 34.70 |
Numerical data
The following are the details of the technical indicators and moving averages that were collected to generate this technical analysis:
| RSI (14): | 56.24 | |
| MACD (12,26,9): | 0.1400 | |
| Directional Movement: | 13.03 | |
| AROON (14): | 35.72 | |
| DEMA (21): | 25.86 | |
| Parabolic SAR (0,02-0,02-0,2): | 25.54 | |
| Elder Ray (13): | -0.03 | |
| Super Trend (3,10): | 25.37 | |
| Zig ZAG (10): | 25.65 | |
| VORTEX (21): | 1.0200 | |
| Stochastique (14,3,5): | 38.19 | |
| TEMA (21): | 25.79 | |
| Williams %R (14): | -71.84 | |
| Chande Momentum Oscillator (20): | 0.03 | |
| Repulse (5,40,3): | -1.0400 | |
| ROCnROLL: | -1 | |
| TRIX (15,9): | 0.0900 | |
| Courbe Coppock: | 0.24 |
| MA7: | 24.33 | |
| MA20: | 23.82 | |
| MA50: | 23.55 | |
| MA100: | 19.97 | |
| MAexp7: | 25.71 | |
| MAexp20: | 25.67 | |
| MAexp50: | 25.37 | |
| MAexp100: | 25.04 | |
| Price / MA7: | +4.69% | |
| Price / MA20: | +6.93% | |
| Price / MA50: | +8.15% | |
| Price / MA100: | +27.54% | |
| Price / MAexp7: | -0.93% | |
| Price / MAexp20: | -0.78% | |
| Price / MAexp50: | +0.39% | |
| Price / MAexp100: | +1.72% |
About author

Online


Add a comment
Comments
0 comments on the analysis CHAINLINK - LINK/USD - 15 min.