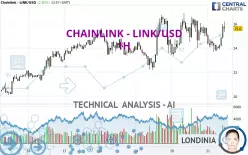
CHAINLINK - LINK/USD - 1H - Technical analysis published on 01/21/2025 (GMT)
- 58
- 0
Click here for a new analysis!
- Timeframe : 1H
- - Analysis generated on
- Status : TARGET REACHED

Summary of the analysis

Additional analysis
Quotes
CHAINLINK - LINK/USD rating 25.60 USD. The price has increased by +2.20% since the last closing and was between 23.66 USD and 26.21 USD. This implies that the price is at +8.20% from its lowest and at -2.33% from its highest.Here is a more detailed summary of the historical variations registered by CHAINLINK - LINK/USD:
Near a new HIGH record (1st january)
Type : Bullish
Timeframe : Weekly
Near a new HIGH record (1 month)
Type : Bullish
Timeframe : Weekly
The Central Volumes scanner notes the presence of abnormal volumes:
Abnormal volumes
Timeframe : 50 days
Technical
A technical analysis in 1H of this CHAINLINK - LINK/USD chart shows a strongly bullish trend. The signals given by moving averages are 85.71% bullish. This strongly bullish trend seems to be running out of steam given the signals being given by short-term moving averages. The Central Indicators market scanner is currently detecting a bearish signal that could impact this trend:
Moving Average bearish crossovers : MA20 & MA50
Type : Bearish
Timeframe : 1 hour
An assessment of technical indicators shows a strong bullish signal.
Caution: the Central Indicators scanner currently detects an excess:
CCI indicator is overbought : over 100
Type : Neutral
Timeframe : 1 hour
Williams %R indicator is overbought : over -20
Type : Neutral
Timeframe : 1 hour
MACD indicator is back over 0
Type : Bullish
Timeframe : 1 hour
Central Patterns, the scanner specializing in chart patterns, did not identify any signals.
The Central Candlesticks scanner which studies Japanese candlesticks did not detect anything.
| S3 | S2 | S1 | Price | R1 | R2 | |
|---|---|---|---|---|---|---|
| ProTrendLines | 21.73 | 23.85 | 25.37 | 25.60 | 26.89 | 29.22 |
| Change (%) | -15.12% | -6.84% | -0.90% | - | +5.04% | +14.14% |
| Change | -3.87 | -1.75 | -0.23 | - | +1.29 | +3.62 |
| Level | Major | Major | Major | - | Intermediate | Major |
Attention could also be paid to pivot points to set price objectives:
| Pivot points | S3 | S2 | S1 | PP | R1 | R2 | R3 |
|---|---|---|---|---|---|---|---|
| Standard | 19.81 | 21.60 | 23.32 | 25.11 | 26.83 | 28.62 | 30.34 |
| Camarilla | 24.09 | 24.41 | 24.73 | 25.05 | 25.37 | 25.69 | 26.02 |
| Woodie | 19.79 | 21.58 | 23.30 | 25.09 | 26.81 | 28.60 | 30.32 |
| Fibonacci | 21.60 | 22.94 | 23.77 | 25.11 | 26.45 | 27.28 | 28.62 |
| Pivot points | S3 | S2 | S1 | PP | R1 | R2 | R3 |
|---|---|---|---|---|---|---|---|
| Standard | 11.58 | 14.71 | 19.40 | 22.53 | 27.22 | 30.35 | 35.04 |
| Camarilla | 21.93 | 22.65 | 23.36 | 24.08 | 24.80 | 25.51 | 26.23 |
| Woodie | 12.35 | 15.10 | 20.17 | 22.92 | 27.99 | 30.74 | 35.81 |
| Fibonacci | 14.71 | 17.70 | 19.55 | 22.53 | 25.52 | 27.37 | 30.35 |
| Pivot points | S3 | S2 | S1 | PP | R1 | R2 | R3 |
|---|---|---|---|---|---|---|---|
| Standard | 4.89 | 12.29 | 16.13 | 23.53 | 27.37 | 34.77 | 38.61 |
| Camarilla | 16.88 | 17.91 | 18.94 | 19.97 | 21.00 | 22.03 | 23.06 |
| Woodie | 3.11 | 11.40 | 14.35 | 22.64 | 25.59 | 33.88 | 36.83 |
| Fibonacci | 12.29 | 16.58 | 19.24 | 23.53 | 27.82 | 30.48 | 34.77 |
Numerical data
The following is the status of technical indicators and moving averages registered at the time this technical analysis was created:
| RSI (14): | 59.62 | |
| MACD (12,26,9): | 0.0100 | |
| Directional Movement: | 6.12 | |
| AROON (14): | 50.00 | |
| DEMA (21): | 24.87 | |
| Parabolic SAR (0,02-0,02-0,2): | 23.71 | |
| Elder Ray (13): | 1.01 | |
| Super Trend (3,10): | 26.08 | |
| Zig ZAG (10): | 26.07 | |
| VORTEX (21): | 0.9900 | |
| Stochastique (14,3,5): | 79.41 | |
| TEMA (21): | 24.83 | |
| Williams %R (14): | -4.80 | |
| Chande Momentum Oscillator (20): | 1.07 | |
| Repulse (5,40,3): | 6.7400 | |
| ROCnROLL: | 1 | |
| TRIX (15,9): | -0.0700 | |
| Courbe Coppock: | 3.92 |
| MA7: | 24.25 | |
| MA20: | 22.37 | |
| MA50: | 23.52 | |
| MA100: | 18.65 | |
| MAexp7: | 25.08 | |
| MAexp20: | 24.90 | |
| MAexp50: | 24.79 | |
| MAexp100: | 24.28 | |
| Price / MA7: | +5.57% | |
| Price / MA20: | +14.44% | |
| Price / MA50: | +8.84% | |
| Price / MA100: | +37.27% | |
| Price / MAexp7: | +2.07% | |
| Price / MAexp20: | +2.81% | |
| Price / MAexp50: | +3.27% | |
| Price / MAexp100: | +5.44% |
About author

Online


Add a comment
Comments
0 comments on the analysis CHAINLINK - LINK/USD - 1H