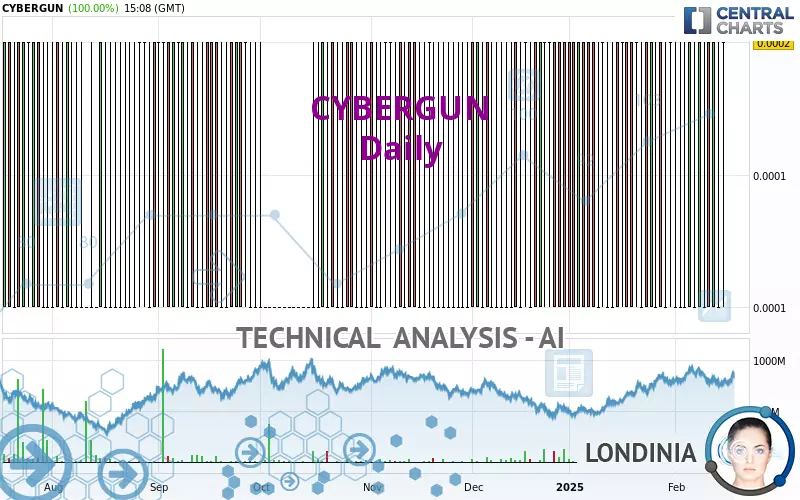
CYBERGUN - Daily - Technical analysis published on 02/17/2025 (GMT)
- 122
- 0
Click here for a new analysis!
- Timeframe : Daily
- - Analysis generated on
- Status : INVALID
Summary of the analysis

Additional analysis
Quotes
CYBERGUN rating 0.0002 EUR. The price registered an increase of +100.00% on the session and was between 0.0001 EUR and 0.0002 EUR. This implies that the price is at +100.00% from its lowest and at 0% from its highest.The Central Gaps scanner detects a bullish opening. A small advantage for buyers in the very short term.
Bullish opening
Type : Bullish
Timeframe : Openning
A study of price movements over other periods shows the following variations:
New LOW record (5 years)
Type : Bearish
Timeframe : Weekly
New LOW record (1 year)
Type : Bearish
Timeframe : Weekly
Technical
A technical analysis in Daily of this CYBERGUN chart shows a slightly bullish trend. 50.00% of the signals given by moving averages are bullish. The slightly bullish signals given by short-term moving averages do not show a strengthening of this global trend. The Central Indicators scanner detects bullish signals on moving averages that could impact this trend:
Bullish price crossover with Moving Average 20
Type : Bullish
Timeframe : Daily
Bullish price crossover with Moving Average 50
Type : Bullish
Timeframe : Daily
Bullish price crossover with Moving Average 100
Type : Bullish
Timeframe : Daily
Bullish price crossover with adaptative moving average 20
Type : Bullish
Timeframe : Daily
Bullish price crossover with adaptative moving average 50
Type : Bullish
Timeframe : Daily
Bullish price crossover with adaptative moving average 100
Type : Bullish
Timeframe : Daily
In fact, 11 technical indicators on 18 studied are currently positioned bullish. Caution: the Central Indicators scanner currently detects an excess:
Williams %R indicator is overbought : over -20
Type : Neutral
Timeframe : Daily
Pivot points : price is over resistance 1
Type : Neutral
Timeframe : Daily
Pivot points : price is over resistance 1
Type : Neutral
Timeframe : Weekly
RSI indicator is back over 50
Type : Bullish
Timeframe : Daily
MACD crosses UP its Moving Average
Type : Bullish
Timeframe : Daily
An analysis of the price chart with the Central Patterns scanner (detector of chart patterns and resistances and supports) shows a result that can have an impact on the price change:
Horizontal resistance is broken
Type : Bullish
Timeframe : Daily
Central Candlesticks, the scanner specialised in Japanese candlesticks, detects this inversion signal that could impact the current short-term trend:
Doji
Type : Neutral
Timeframe : Daily
| R1 | Price | R2 | R3 | |
|---|---|---|---|---|
| ProTrendLines | 0.0002 | 0.0002 | 0.0004 | 0.0017 |
| Change (%) | 0% | - | +100.00% | +750.00% |
| Change | 0 | - | +0.0002 | +0.0015 |
| Level | Major | - | Minor | Minor |
Pivot points can also be used to set your price objectives. Here is the price situation in relation to pivot points:
| Pivot points | S3 | S2 | S1 | PP | R1 | R2 | R3 |
|---|---|---|---|---|---|---|---|
| Standard | 0.0000 | 0.0000 | 0.0001 | 0.0001 | 0.0002 | 0.0002 | 0.0003 |
| Camarilla | 0.0001 | 0.0001 | 0.0001 | 0.0001 | 0.0001 | 0.0001 | 0.0001 |
| Woodie | -0.0001 | 0.0000 | 0.0001 | 0.0001 | 0.0002 | 0.0002 | 0.0003 |
| Fibonacci | 0.0000 | 0.0001 | 0.0001 | 0.0001 | 0.0002 | 0.0002 | 0.0002 |
| Pivot points | S3 | S2 | S1 | PP | R1 | R2 | R3 |
|---|---|---|---|---|---|---|---|
| Standard | 0.0000 | 0.0001 | 0.0001 | 0.0002 | 0.0002 | 0.0003 | 0.0003 |
| Camarilla | 0.0002 | 0.0002 | 0.0002 | 0.0002 | 0.0002 | 0.0002 | 0.0002 |
| Woodie | 0.0001 | 0.0001 | 0.0002 | 0.0002 | 0.0003 | 0.0003 | 0.0004 |
| Fibonacci | 0.0001 | 0.0001 | 0.0001 | 0.0002 | 0.0002 | 0.0002 | 0.0003 |
Numerical data
The following is the status of technical indicators and moving averages registered at the time this technical analysis was created:
| RSI (14): | 53.90 | |
| MACD (12,26,9): | 0.0000 | |
| Directional Movement: | 0.0137 | |
| AROON (14): | 0 | |
| DEMA (21): | 0.0001 | |
| Parabolic SAR (0,02-0,02-0,2): | 0.0001 | |
| Elder Ray (13): | 0.0001 | |
| Super Trend (3,10): | 0.0002 | |
| Zig ZAG (10): | 0.0002 | |
| VORTEX (21): | 1.0000 | |
| Stochastique (14,3,5): | 66.67 | |
| TEMA (21): | 0.0002 | |
| Williams %R (14): | 0.00 | |
| Chande Momentum Oscillator (20): | 0.0001 | |
| Repulse (5,40,3): | -34.0849 | |
| ROCnROLL: | 1 | |
| TRIX (15,9): | 0.3793 | |
| Courbe Coppock: | 46.36 |
| MA7: | 0.0001 | |
| MA20: | 0.0001 | |
| MA50: | 0.0001 | |
| MA100: | 0.0001 | |
| MAexp7: | 0.0001 | |
| MAexp20: | 0.0001 | |
| MAexp50: | 0.0001 | |
| MAexp100: | 0.0005 | |
| Price / MA7: | +100.00% | |
| Price / MA20: | +100.00% | |
| Price / MA50: | +100.00% | |
| Price / MA100: | +100.00% | |
| Price / MAexp7: | +100.00% | |
| Price / MAexp20: | +100.00% | |
| Price / MAexp50: | +100.00% | |
| Price / MAexp100: | -60.00% |
News
The latest news and videos published on CYBERGUN at the time of the analysis were as follows:
- CYBERGUN AND EVIKE.COM EXTEND THEIR COLLABORATION TO THE EUROPEAN MARKET TO BOLSTER THEIR LEADERSHIP ON THE MASS MARKET
- 2020 FINANCIAL REPORTING CALENDAR
- FINAL APPROVAL FOR PLAN TO RESTRUCTURE FINANCIAL DEBT // CYBERGUN NOW FULLY DEBT-FREE
- CYBERGUN AND MANUFACTURER CANIK ANNOUNCE THE CONCLUSION OF AN EXCLUSIVE GLOBAL LICENSE AGREEMENT
-
 Cybergun
About author
Online


Add a comment
Comments
0 comments on the analysis CYBERGUN - Daily