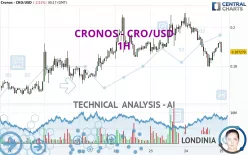
CRONOS - CRO/USD - 1H - Technical analysis published on 11/25/2024 (GMT)
- 118
- 0
Click here for a new analysis!
- Timeframe : 1H
- - Analysis generated on
- Status : INVALID

Summary of the analysis

Additional analysis
Quotes
The CRONOS - CRO/USD rating is 0.187279 USD. On the day, this instrument lost -2.51% with the lowest point at 0.186922 USD and the highest point at 0.192471 USD. The deviation from the price is +0.19% for the low point and -2.70% for the high point.A study of price movements over other periods shows the following variations:
Abnormal volumes
Timeframe : 5 days
Abnormal volumes
Timeframe : 20 days
Abnormal volumes
Timeframe : 50 days
Technical
Technical analysis of this 1H chart of CRONOS - CRO/USD indicates that the overall trend is slightly bearish. 53.57% of the signals given by moving averages are bearish. This bearish trend does not seem to be increasing given the slightly bearish signals given by short-term moving averages. An assessment of moving averages reveals several bearish signals that could impact this trend:
Moving Average bearish crossovers : AMA50 & AMA100
Type : Bearish
Timeframe : 1 hour
Bearish price crossover with Moving Average 20
Type : Bearish
Timeframe : 1 hour
Bearish price crossover with Moving Average 100
Type : Bearish
Timeframe : 1 hour
Bearish price crossover with adaptative moving average 20
Type : Bearish
Timeframe : 1 hour
Bearish price crossover with adaptative moving average 50
Type : Bearish
Timeframe : 1 hour
Bearish price crossover with adaptative moving average 100
Type : Bearish
Timeframe : 1 hour
An assessment of technical indicators shows a slightly bullish signal.
The Central Indicators scanner found this result concerning these indicators:
RSI indicator is back under 50
Type : Bearish
Timeframe : 1 hour
The Central Patterns scanner, which studies chart patterns, resistances and supports, has identified this signal:
Near horizontal resistance
Type : Bearish
Timeframe : 1 hour
The Central Candlesticks scanner, specialised in Japanese candlesticks, did not identify any signals.
| S3 | S2 | S1 | Price | R1 | R2 | R3 | |
|---|---|---|---|---|---|---|---|
| ProTrendLines | 0.153371 | 0.169333 | 0.184662 | 0.187279 | 0.191150 | 0.196271 | 0.203371 |
| Change (%) | -18.11% | -9.58% | -1.40% | - | +2.07% | +4.80% | +8.59% |
| Change | -0.033908 | -0.017946 | -0.002617 | - | +0.003871 | +0.008992 | +0.016092 |
| Level | Minor | Major | Minor | - | Major | Minor | Major |
Attention could also be paid to pivot points to set price objectives:
| Pivot points | S3 | S2 | S1 | PP | R1 | R2 | R3 |
|---|---|---|---|---|---|---|---|
| Standard | 0.151245 | 0.165490 | 0.178798 | 0.193043 | 0.206351 | 0.220596 | 0.233904 |
| Camarilla | 0.184530 | 0.187056 | 0.189581 | 0.192107 | 0.194633 | 0.197158 | 0.199684 |
| Woodie | 0.150778 | 0.165256 | 0.178331 | 0.192809 | 0.205884 | 0.220362 | 0.233437 |
| Fibonacci | 0.165490 | 0.176015 | 0.182517 | 0.193043 | 0.203568 | 0.210070 | 0.220596 |
| Pivot points | S3 | S2 | S1 | PP | R1 | R2 | R3 |
|---|---|---|---|---|---|---|---|
| Standard | 0.115202 | 0.134132 | 0.169424 | 0.188354 | 0.223646 | 0.242576 | 0.277868 |
| Camarilla | 0.189804 | 0.194774 | 0.199745 | 0.204715 | 0.209685 | 0.214656 | 0.219626 |
| Woodie | 0.123382 | 0.138223 | 0.177604 | 0.192445 | 0.231826 | 0.246667 | 0.286048 |
| Fibonacci | 0.134132 | 0.154845 | 0.167642 | 0.188354 | 0.209067 | 0.221864 | 0.242576 |
| Pivot points | S3 | S2 | S1 | PP | R1 | R2 | R3 |
|---|---|---|---|---|---|---|---|
| Standard | 0.058208 | 0.064563 | 0.068778 | 0.075133 | 0.079348 | 0.085703 | 0.089918 |
| Camarilla | 0.070085 | 0.071054 | 0.072023 | 0.072992 | 0.073961 | 0.074930 | 0.075899 |
| Woodie | 0.057137 | 0.064028 | 0.067707 | 0.074598 | 0.078277 | 0.085168 | 0.088847 |
| Fibonacci | 0.064563 | 0.068601 | 0.071096 | 0.075133 | 0.079171 | 0.081666 | 0.085703 |
Numerical data
The following is the status of technical indicators and moving averages registered at the time this technical analysis was created:
| RSI (14): | 48.99 | |
| MACD (12,26,9): | -0.0013 | |
| Directional Movement: | -6.049484 | |
| AROON (14): | -35.714286 | |
| DEMA (21): | 0.188646 | |
| Parabolic SAR (0,02-0,02-0,2): | 0.181862 | |
| Elder Ray (13): | 0.001094 | |
| Super Trend (3,10): | 0.195462 | |
| Zig ZAG (10): | 0.189521 | |
| VORTEX (21): | 0.9022 | |
| Stochastique (14,3,5): | 80.62 | |
| TEMA (21): | 0.187879 | |
| Williams %R (14): | -26.61 | |
| Chande Momentum Oscillator (20): | 0.001616 | |
| Repulse (5,40,3): | -1.3941 | |
| ROCnROLL: | 2 | |
| TRIX (15,9): | -0.1672 | |
| Courbe Coppock: | 3.11 |
| MA7: | 0.187885 | |
| MA20: | 0.153843 | |
| MA50: | 0.109311 | |
| MA100: | 0.095963 | |
| MAexp7: | 0.189662 | |
| MAexp20: | 0.190806 | |
| MAexp50: | 0.191844 | |
| MAexp100: | 0.189036 | |
| Price / MA7: | -0.32% | |
| Price / MA20: | +21.73% | |
| Price / MA50: | +71.33% | |
| Price / MA100: | +95.16% | |
| Price / MAexp7: | -1.26% | |
| Price / MAexp20: | -1.85% | |
| Price / MAexp50: | -2.38% | |
| Price / MAexp100: | -0.93% |
About author

Online


Add a comment
Comments
0 comments on the analysis CRONOS - CRO/USD - 1H