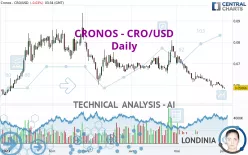
CRONOS - CRO/USD - Daily - Technical analysis published on 06/02/2023 (GMT)
- 141
- 0
Click here for a new analysis!
- Timeframe : Daily
- - Analysis generated on
- Status : TARGET REACHED

Summary of the analysis

Additional analysis
Quotes
CRONOS - CRO/USD rating 0.058660 USD. The price registered a decrease of -0.03% on the session with the lowest point at 0.058050 USD and the highest point at 0.058830 USD. The deviation from the price is +1.05% for the low point and -0.29% for the high point.A bearish opening was detected by the Central Gaps scanner. Sellers are trying to impose a bearish trend in the very short term.
Bearish opening
Type : Bearish
Timeframe : Openning
A study of price movements over other periods shows the following variations:
Near a new LOW record (1st january)
Type : Bearish
Timeframe : Weekly
New LOW record (1 month)
Type : Bearish
Timeframe : Weekly
Technical
Technical analysis of CRONOS - CRO/USD in Daily shows a overall strongly bearish trend. 92.86% of the signals given by moving averages are bearish. This strongly bearish trend is supported by the strong bearish signals given by short-term moving averages. There is no crossing of moving average by the price or crossing of moving averages between themselves.
In fact, according to the parameters integrated into the Central Analyzer system, 12 technical indicators out of 18 analysed are currently bearish. Caution: the Central Indicators scanner currently detects an excess:
CCI indicator is oversold : under -100
Type : Neutral
Timeframe : Daily
RSI indicator: bullish divergence
Type : Bullish
Timeframe : Daily
Williams %R indicator is oversold : under -80
Type : Neutral
Timeframe : Daily
No signals are given by Central Patterns, a market scanner specialised in chart patterns, resistances and supports.
The Central Candlesticks scanner, specialised in Japanese candlesticks, did not identify any signals.
| S1 | Price | R1 | R2 | R3 | |
|---|---|---|---|---|---|
| ProTrendLines | 0.055267 | 0.058660 | 0.062967 | 0.073850 | 0.078220 |
| Change (%) | -5.78% | - | +7.34% | +25.89% | +33.34% |
| Change | -0.003393 | - | +0.004307 | +0.015190 | +0.019560 |
| Level | Intermediate | - | Intermediate | Minor | Minor |
Pivot points can also be used to set your price objectives. Here is the price situation in relation to pivot points:
| Pivot points | S3 | S2 | S1 | PP | R1 | R2 | R3 |
|---|---|---|---|---|---|---|---|
| Standard | 0.056417 | 0.057373 | 0.058027 | 0.058983 | 0.059637 | 0.060593 | 0.061247 |
| Camarilla | 0.058237 | 0.058385 | 0.058532 | 0.058680 | 0.058828 | 0.058975 | 0.059123 |
| Woodie | 0.056265 | 0.057298 | 0.057875 | 0.058908 | 0.059485 | 0.060518 | 0.061095 |
| Fibonacci | 0.057373 | 0.057988 | 0.058368 | 0.058983 | 0.059598 | 0.059978 | 0.060593 |
| Pivot points | S3 | S2 | S1 | PP | R1 | R2 | R3 |
|---|---|---|---|---|---|---|---|
| Standard | 0.054317 | 0.056573 | 0.058347 | 0.060603 | 0.062377 | 0.064633 | 0.066407 |
| Camarilla | 0.059012 | 0.059381 | 0.059751 | 0.060120 | 0.060489 | 0.060859 | 0.061228 |
| Woodie | 0.054075 | 0.056453 | 0.058105 | 0.060483 | 0.062135 | 0.064513 | 0.066165 |
| Fibonacci | 0.056573 | 0.058113 | 0.059064 | 0.060603 | 0.062143 | 0.063094 | 0.064633 |
| Pivot points | S3 | S2 | S1 | PP | R1 | R2 | R3 |
|---|---|---|---|---|---|---|---|
| Standard | 0.039197 | 0.049013 | 0.054287 | 0.064103 | 0.069377 | 0.079193 | 0.084467 |
| Camarilla | 0.055410 | 0.056794 | 0.058177 | 0.059560 | 0.060943 | 0.062327 | 0.063710 |
| Woodie | 0.036925 | 0.047878 | 0.052015 | 0.062968 | 0.067105 | 0.078058 | 0.082195 |
| Fibonacci | 0.049013 | 0.054778 | 0.058339 | 0.064103 | 0.069868 | 0.073429 | 0.079193 |
Numerical data
The following are the details of the technical indicators and moving averages that were collected to generate this technical analysis:
| RSI (14): | 31.10 | |
| MACD (12,26,9): | -0.0020 | |
| Directional Movement: | -17.495427 | |
| AROON (14): | -100.000000 | |
| DEMA (21): | 0.058823 | |
| Parabolic SAR (0,02-0,02-0,2): | 0.061456 | |
| Elder Ray (13): | -0.002051 | |
| Super Trend (3,10): | 0.062448 | |
| Zig ZAG (10): | 0.058770 | |
| VORTEX (21): | 0.8778 | |
| Stochastique (14,3,5): | 11.50 | |
| TEMA (21): | 0.058369 | |
| Williams %R (14): | -85.48 | |
| Chande Momentum Oscillator (20): | -0.002970 | |
| Repulse (5,40,3): | -1.3520 | |
| ROCnROLL: | 2 | |
| TRIX (15,9): | -0.4634 | |
| Courbe Coppock: | 10.76 |
| MA7: | 0.059860 | |
| MA20: | 0.061417 | |
| MA50: | 0.066274 | |
| MA100: | 0.068716 | |
| MAexp7: | 0.059658 | |
| MAexp20: | 0.061512 | |
| MAexp50: | 0.064772 | |
| MAexp100: | 0.068204 | |
| Price / MA7: | -2.00% | |
| Price / MA20: | -4.49% | |
| Price / MA50: | -11.49% | |
| Price / MA100: | -14.63% | |
| Price / MAexp7: | -1.67% | |
| Price / MAexp20: | -4.64% | |
| Price / MAexp50: | -9.44% | |
| Price / MAexp100: | -13.99% |
About author
Online


Add a comment
Comments
0 comments on the analysis CRONOS - CRO/USD - Daily