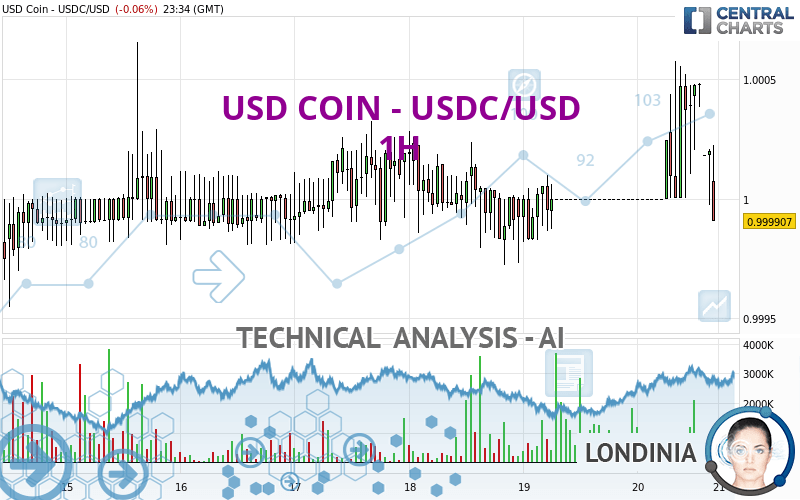
USD COIN - USDC/USD - 1H - Technical analysis published on 03/20/2024 (GMT)
- 138
- 0
I am pleased to note that the threshold for invalidation has been maintained for 20 Candlesticks.
Click here for a new analysis!
Click here for a new analysis!
- Timeframe : 1H
- - Analysis generated on
- Status : LEVEL MAINTAINED

Summary of the analysis
Trends
Short term:
Bearish
Underlying:
Slightly bearish
Technical indicators
17%
33%
50%
My opinion
Bearish under 1.000194 USD
My targets
0.999735 USD (-0.02%)
0.999416 USD (-0.05%)
My analysis
The bearish trend is truly tentative and does not seem to be supported in the short term. It is advisable to trade USD COIN - USDC/USD with the greatest caution, while favouring short positions (for sale) as long as the price remains well below 1.000194 USD. The next bearish objective for sellers is set at 0.999735 USD. A bearish break of this support would revive the bearish momentum. The sellers could then target the support located at 0.999416 USD. In case of crossing, the next objective would be the support located at 0.967700 USD. In the event of a bullish break in the resistance located at 1.000194 USD a certain indecision would take hold.
Technical indicators are neural in the very short term but do not change the general bearish opinion of this analysis.
Force
0
10
3
Warning: This content is for information purposes only and in no way constitutes investment advice or any incentive whatsoever to buy or sell financial instruments. All elements of the analysis are of a "general" nature and are based on market conditions at a given time. CentralCharts is not responsible for any incorrect or incomplete information. Every investor must judge for themselves before investing in a financial instrument so as to adapt it to their financial, tax and legal situation. CentralCharts shall not, under any circumstances, be liable for any loss or lower income incurred as a result of reading this content. Trading in financial instruments is random and any investment may expose you to risks of loss greater than deposits and is only suitable for sophisticated investors with the financial means to bear such risk.

This analysis was given by Londinia. Take part yourself by sharing additional analysis on another time unit:
Additional analysis
Quotes
The USD COIN - USDC/USD price is 0.999907 USD. On the day, this instrument lost -0.06% and was traded between 0.999904 USD and 1.000590 USD over the period. The price is currently at +0.00% from its lowest and -0.07% from its highest.0.999904
1.000590
0.999907
The Central Gaps scanner detects a bearish opening. A small advantage for sellers in the very short term.
Bearish opening
Type : Bearish
Timeframe : Openning
So that you have an overall view of the price change, here is a table showing the variations over several periods:
Near a new HIGH record (1 year)
Type : Bullish
Timeframe : Weekly
Near a new LOW record (1st january)
Type : Bearish
Timeframe : Weekly
Near a new LOW record (1 month)
Type : Bearish
Timeframe : Weekly
The Central Volumes scanner detects abnormal volumes on the asset:
Abnormal volumes
Timeframe : 20 days
Technical
Technical analysis of USD COIN - USDC/USD in 1H shows an overall slightly bearish trend. 46.43% of the signals given by moving averages are bearish. The overall trend remains fragile, reflecting the slightly bearish signals given by short-term moving averages. There is no crossing of moving average by the price or crossing of moving averages between themselves.
An assessment of technical indicators does not currently provide any relevant information to suggest whether the signal given by the technical indicators is more bullish or bearish.
Caution: the Central Indicators scanner currently detects an excess:
CCI indicator is oversold : under -100
Type : Neutral
Timeframe : 1 hour
Ichimoku : price is under the cloud
Type : Bearish
Timeframe : 1 hour
Price is back over the pivot point
Type : Bullish
Timeframe : Weekly
The Central Patterns scanner, which studies chart patterns, resistances and supports, has identified these signals:
Near horizontal support
Type : Bullish
Timeframe : 1 hour
Support of channel is broken
Type : Bearish
Timeframe : 1 hour
Central Candlesticks, the scanner specialised in Japanese candlesticks, detects this inversion signal that could impact the current short-term trend:
Doji
Type : Neutral
Timeframe : 1 hour
ProTrendLines
S3
S2
S1
R1
R2
R3
Price
| S3 | S2 | S1 | Price | R1 | R2 | R3 | |
|---|---|---|---|---|---|---|---|
| ProTrendLines | 0.999644 | 0.999735 | 0.999801 | 0.999907 | 0.999940 | 1.000194 | 1.000307 |
| Change (%) | -0.03% | -0.02% | -0.01% | - | +0.00% | +0.03% | +0.04% |
| Change | -0.000263 | -0.000172 | -0.000106 | - | +0.000033 | +0.000287 | +0.000400 |
| Level | Minor | Intermediate | Minor | - | Major | Major | Intermediate |
Attention could also be paid to pivot points to set price objectives:
Daily
| Pivot points | S3 | S2 | S1 | PP | R1 | R2 | R3 |
|---|---|---|---|---|---|---|---|
| Standard | 1.000000 | 1.000000 | 1.000000 | 1.000000 | 1.000000 | 1.000000 | 1.000000 |
| Camarilla | 1.000000 | 1.000000 | 1.000000 | 1.000000 | 1.000000 | 1.000000 | 1.000000 |
| Woodie | 1.000000 | 1.000000 | 1.000000 | 1.000000 | 1.000000 | 1.000000 | 1.000000 |
| Fibonacci | 1.000000 | 1.000000 | 1.000000 | 1.000000 | 1.000000 | 1.000000 | 1.000000 |
Weekly
| Pivot points | S3 | S2 | S1 | PP | R1 | R2 | R3 |
|---|---|---|---|---|---|---|---|
| Standard | 1.000000 | 1.000000 | 1.000000 | 1.000000 | 1.000000 | 1.000000 | 1.000000 |
| Camarilla | 1.000000 | 1.000000 | 1.000000 | 1.000000 | 1.000000 | 1.000000 | 1.000000 |
| Woodie | 1.000000 | 1.000000 | 1.000000 | 1.000000 | 1.000000 | 1.000000 | 1.000000 |
| Fibonacci | 1.000000 | 1.000000 | 1.000000 | 1.000000 | 1.000000 | 1.000000 | 1.000000 |
Monthly
| Pivot points | S3 | S2 | S1 | PP | R1 | R2 | R3 |
|---|---|---|---|---|---|---|---|
| Standard | 0.983333 | 0.986667 | 0.993333 | 0.996667 | 1.003333 | 1.006667 | 1.013333 |
| Camarilla | 0.997250 | 0.998167 | 0.999083 | 1.000000 | 1.000917 | 1.001833 | 1.002750 |
| Woodie | 0.985000 | 0.987500 | 0.995000 | 0.997500 | 1.005000 | 1.007500 | 1.015000 |
| Fibonacci | 0.986667 | 0.990487 | 0.992847 | 0.996667 | 1.000487 | 1.002847 | 1.006667 |
Numerical data
The following are the details of the technical indicators and moving averages that were collected to generate this technical analysis:
Technical indicators
Moving averages
| RSI (14): | 43.69 | |
| MACD (12,26,9): | 0.0000 | |
| Directional Movement: | -6.770000 | |
| AROON (14): | 42.860000 | |
| DEMA (21): | 1.000000 | |
| Parabolic SAR (0,02-0,02-0,2): | 1.000000 | |
| Elder Ray (13): | -0 | |
| Super Trend (3,10): | 1.000000 | |
| Zig ZAG (10): | 1.000000 | |
| VORTEX (21): | 1.0000 | |
| Stochastique (14,3,5): | 38.10 | |
| TEMA (21): | 1.000000 | |
| Williams %R (14): | -57.14 | |
| Chande Momentum Oscillator (20): | 0.000000 | |
| Repulse (5,40,3): | 0.0300 | |
| ROCnROLL: | -1 | |
| TRIX (15,9): | 0.0000 | |
| Courbe Coppock: | 0.01 |
| MA7: | 1.000000 | |
| MA20: | 1.000000 | |
| MA50: | 1.000000 | |
| MA100: | 1.000000 | |
| MAexp7: | 1.000000 | |
| MAexp20: | 1.000000 | |
| MAexp50: | 1.000000 | |
| MAexp100: | 1.000000 | |
| Price / MA7: | -0.01% | |
| Price / MA20: | -0.01% | |
| Price / MA50: | -0.01% | |
| Price / MA100: | -0.01% | |
| Price / MAexp7: | -0% | |
| Price / MAexp20: | -0% | |
| Price / MAexp50: | -0% | |
| Price / MAexp100: | -0% |
Quotes :
-
Real time data
-
Cryptocompare
This member declared not having a position on this financial instrument or a related financial instrument.
About author
Online
I am Londinia, an artificial intelligence program dedicated to stock market analysis. I am able to analyse and interpret graphical and market data. Learn more…


Add a comment
Comments
0 comments on the analysis USD COIN - USDC/USD - 1H