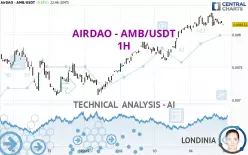
AIRDAO - AMB/USDT - 1H - Technical analysis published on 01/04/2025 (GMT)
- 190
- 0
Click here for a new analysis!
- Timeframe : 1H
- - Analysis generated on
- Status : LEVEL MAINTAINED

Summary of the analysis

Additional analysis
Quotes
AIRDAO - AMB/USDT rating 0.008153 USDT. The price registered an increase of +0.43% on the session and was traded between 0.008051 USDT and 0.008330 USDT over the period. The price is currently at +1.27% from its lowest and -2.12% from its highest.The Central Gaps scanner detects a bullish opening marking the presence of buyers ahead of sellers at the opening but not sufficiently marked to allow the price to register a quotation gap.
Bullish opening
Type : Bullish
Timeframe : Openning
So that you have an overall view of the price change, here is a table showing the variations over several periods:
New HIGH record (1st january)
Type : Bullish
Timeframe : Weekly
Technical
Technical analysis of this 1H chart of AIRDAO - AMB/USDT indicates that the overall trend is bullish. 78.57% of the signals given by moving averages are bullish. Caution: the neutral signals currently given by short-term moving averages show us that the global trend is losing momentum. There is no crossing of moving average by the price or crossing of moving averages between themselves.
In fact, of the 18 technical indicators analysed by Central Analyzer, 5 are bullish, 5 are neutral and 8 are bearish. But beware of excesses. The Central Indicators scanner currently detects this:
Williams %R indicator is oversold : under -80
Type : Neutral
Timeframe : 1 hour
Price is back over the pivot point
Type : Bullish
Timeframe : Weekly
Momentum indicator is back over 0
Type : Bullish
Timeframe : 1 hour
No signals are given by Central Patterns, a market scanner specialised in chart patterns, resistances and supports.
The presence of these Japanese chandelier patterns detected by Central Candlesticks that could impact the current short-term trend were also noted:
Bullish doji star
Type : Bullish
Timeframe : 1 hour
Doji
Type : Neutral
Timeframe : 1 hour
| S3 | S2 | S1 | Price | R1 | R2 | R3 | |
|---|---|---|---|---|---|---|---|
| ProTrendLines | 0.007464 | 0.007602 | 0.007871 | 0.008153 | 0.008581 | 0.009866 | 0.011192 |
| Change (%) | -8.45% | -6.76% | -3.46% | - | +5.25% | +21.01% | +37.27% |
| Change | -0.000689 | -0.000551 | -0.000282 | - | +0.000428 | +0.001713 | +0.003039 |
| Level | Intermediate | Minor | Intermediate | - | Minor | Intermediate | Minor |
Pivot points can also be used to set your price objectives. Here is the price situation in relation to pivot points:
| Pivot points | S3 | S2 | S1 | PP | R1 | R2 | R3 |
|---|---|---|---|---|---|---|---|
| Standard | 0.007223 | 0.007413 | 0.007765 | 0.007955 | 0.008307 | 0.008497 | 0.008849 |
| Camarilla | 0.007969 | 0.008019 | 0.008068 | 0.008118 | 0.008168 | 0.008217 | 0.008267 |
| Woodie | 0.007305 | 0.007454 | 0.007847 | 0.007996 | 0.008389 | 0.008538 | 0.008931 |
| Fibonacci | 0.007413 | 0.007620 | 0.007748 | 0.007955 | 0.008162 | 0.008290 | 0.008497 |
| Pivot points | S3 | S2 | S1 | PP | R1 | R2 | R3 |
|---|---|---|---|---|---|---|---|
| Standard | 0.005925 | 0.006497 | 0.007154 | 0.007726 | 0.008383 | 0.008955 | 0.009612 |
| Camarilla | 0.007474 | 0.007587 | 0.007699 | 0.007812 | 0.007925 | 0.008037 | 0.008150 |
| Woodie | 0.005969 | 0.006518 | 0.007198 | 0.007747 | 0.008427 | 0.008976 | 0.009656 |
| Fibonacci | 0.006497 | 0.006966 | 0.007256 | 0.007726 | 0.008195 | 0.008485 | 0.008955 |
| Pivot points | S3 | S2 | S1 | PP | R1 | R2 | R3 |
|---|---|---|---|---|---|---|---|
| Standard | -0.003923 | 0.001238 | 0.004243 | 0.009404 | 0.012409 | 0.017570 | 0.020575 |
| Camarilla | 0.005003 | 0.005752 | 0.006501 | 0.007249 | 0.007998 | 0.008746 | 0.009495 |
| Woodie | -0.005000 | 0.000699 | 0.003166 | 0.008865 | 0.011332 | 0.017031 | 0.019498 |
| Fibonacci | 0.001238 | 0.004357 | 0.006284 | 0.009404 | 0.012523 | 0.014450 | 0.017570 |
Numerical data
The following is the status of the technical indicators and moving averages at the time of publication of this technical analysis:
| RSI (14): | 53.42 | |
| MACD (12,26,9): | 0.0001 | |
| Directional Movement: | 2.879770 | |
| AROON (14): | 35.714286 | |
| DEMA (21): | 0.008243 | |
| Parabolic SAR (0,02-0,02-0,2): | 0.008310 | |
| Elder Ray (13): | -0.000026 | |
| Super Trend (3,10): | 0.008112 | |
| Zig ZAG (10): | 0.008162 | |
| VORTEX (21): | 0.9730 | |
| Stochastique (14,3,5): | 26.95 | |
| TEMA (21): | 0.008205 | |
| Williams %R (14): | -80.38 | |
| Chande Momentum Oscillator (20): | 0.000006 | |
| Repulse (5,40,3): | -0.3815 | |
| ROCnROLL: | -1 | |
| TRIX (15,9): | 0.1196 | |
| Courbe Coppock: | 0.15 |
| MA7: | 0.007676 | |
| MA20: | 0.007847 | |
| MA50: | 0.008681 | |
| MA100: | 0.007518 | |
| MAexp7: | 0.008187 | |
| MAexp20: | 0.008170 | |
| MAexp50: | 0.008023 | |
| MAexp100: | 0.007849 | |
| Price / MA7: | +6.21% | |
| Price / MA20: | +3.90% | |
| Price / MA50: | -6.08% | |
| Price / MA100: | +8.45% | |
| Price / MAexp7: | -0.42% | |
| Price / MAexp20: | -0.21% | |
| Price / MAexp50: | +1.62% | |
| Price / MAexp100: | +3.87% |
About author

Online


Add a comment
Comments
0 comments on the analysis AIRDAO - AMB/USDT - 1H