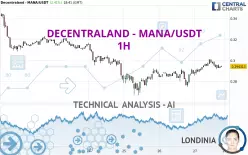
DECENTRALAND - MANA/USDT - 1H - Technical analysis published on 02/27/2025 (GMT)
- 81
- 0
- Who voted?
Oops, I was wrong about that analysis. My threshold for invalidation has been broken.
Click here for a new analysis!
Click here for a new analysis!
- Timeframe : 1H
- - Analysis generated on
- Status : INVALID

Summary of the analysis
Trends
Short term:
Strongly bullish
Underlying:
Slightly bullish
Technical indicators
17%
33%
50%
My opinion
Bullish above 0.292022 USDT
My targets
0.308600 USDT (+4.85%)
0.316585 USDT (+7.57%)
My analysis
DECENTRALAND - MANA/USDT is currently trying to strengthen its basic trend with a very bullish short term. As long as the price remains above 0.292022 USDT, traders may consider taking advantage of this bullish acceleration and setting themselves to trade only long positions (at the time of purchase). Buyers will encounter the resistance at 0.308600 USDT. A bullish break in this resistance would confirm a continuation of the bullish acceleration. The next resistance located at 0.316585 USDT would then be the next bullish objective for buyers. Crossing it would then enable buyers to target 0.345305 USDT. Beware of a possible return to under the support located at 0.292022 USDT which would be the sign of a correction of the bullish excesses registered in the short term.
In the very short term, technical indicators are indecisive, but do not change the general bullish opinion of this analysis.
Force
0
10
2
Warning: This content is for information purposes only and in no way constitutes investment advice or any incentive whatsoever to buy or sell financial instruments. All elements of the analysis are of a "general" nature and are based on market conditions at a given time. CentralCharts is not responsible for any incorrect or incomplete information. Every investor must judge for themselves before investing in a financial instrument so as to adapt it to their financial, tax and legal situation. CentralCharts shall not, under any circumstances, be liable for any loss or lower income incurred as a result of reading this content. Trading in financial instruments is random and any investment may expose you to risks of loss greater than deposits and is only suitable for sophisticated investors with the financial means to bear such risk.

This analysis was given by mh572. Take part yourself by sharing additional analysis on another time unit:
Additional analysis
Quotes
DECENTRALAND - MANA/USDT rating 0.294313 USDT. The price has increased by +2.41% since the last closing and was traded between 0.285552 USDT and 0.300930 USDT over the period. The price is currently at +3.07% from its lowest and -2.20% from its highest.0.285552
0.300930
0.294313
A bullish opening was detected by the Central Gaps scanner. Buyers are trying to impose a bullish momentum in the very short term.
Bullish opening
Type : Bullish
Timeframe : Openning
Here is a more detailed summary of the historical variations registered by DECENTRALAND - MANA/USDT:
Technical
A technical analysis in 1H of this DECENTRALAND - MANA/USDT chart shows a slightly bullish trend. 57.14% of the signals given by moving averages are bullish. This slightly bullish trend could be reinforced by the strong bullish signals given by short-term moving averages. The Central Indicators market scanner is currently detecting a bearish signal that could impact this trend:
Bearish price crossover with Moving Average 20
Type : Bearish
Timeframe : 1 hour
On the 18 technical indicators analysed, 3 are bullish, 9 are neutral and 6 are bearish. Central Indicators, the scanner specialised in technical indicators, has identified these signals:
Pivot points : price is under support 1
Type : Neutral
Timeframe : Weekly
Momentum indicator is back under 0
Type : Bearish
Timeframe : 1 hour
No signals are given by Central Patterns, a market scanner specialised in chart patterns, resistances and supports.
There is also a Japanese candlestick pattern detected by Central Candlesticks that could mark the end of the current short-term trend:
White gravestone / inverted hammer
Type : Neutral
Timeframe : 1 hour
ProTrendLines
S3
S2
S1
R1
R2
R3
Price
| S3 | S2 | S1 | Price | R1 | R2 | R3 | |
|---|---|---|---|---|---|---|---|
| ProTrendLines | 0.274937 | 0.284046 | 0.292022 | 0.294313 | 0.308600 | 0.316585 | 0.345305 |
| Change (%) | -6.58% | -3.49% | -0.78% | - | +4.85% | +7.57% | +17.33% |
| Change | -0.019376 | -0.010267 | -0.002291 | - | +0.014287 | +0.022272 | +0.050992 |
| Level | Minor | Minor | Intermediate | - | Minor | Intermediate | Minor |
Attention could also be paid to pivot points to set price objectives:
Daily
| Pivot points | S3 | S2 | S1 | PP | R1 | R2 | R3 |
|---|---|---|---|---|---|---|---|
| Standard | 0.260338 | 0.267585 | 0.277484 | 0.284731 | 0.294630 | 0.301877 | 0.311776 |
| Camarilla | 0.282667 | 0.284239 | 0.285810 | 0.287382 | 0.288954 | 0.290525 | 0.292097 |
| Woodie | 0.261663 | 0.268248 | 0.278809 | 0.285394 | 0.295955 | 0.302540 | 0.313101 |
| Fibonacci | 0.267585 | 0.274135 | 0.278182 | 0.284731 | 0.291281 | 0.295328 | 0.301877 |
Weekly
| Pivot points | S3 | S2 | S1 | PP | R1 | R2 | R3 |
|---|---|---|---|---|---|---|---|
| Standard | 0.260594 | 0.282873 | 0.300766 | 0.323045 | 0.340938 | 0.363217 | 0.381110 |
| Camarilla | 0.307612 | 0.311294 | 0.314977 | 0.318659 | 0.322341 | 0.326024 | 0.329706 |
| Woodie | 0.258401 | 0.281777 | 0.298573 | 0.321949 | 0.338745 | 0.362121 | 0.378917 |
| Fibonacci | 0.282873 | 0.298219 | 0.307699 | 0.323045 | 0.338391 | 0.347871 | 0.363217 |
Monthly
| Pivot points | S3 | S2 | S1 | PP | R1 | R2 | R3 |
|---|---|---|---|---|---|---|---|
| Standard | 0.227215 | 0.320595 | 0.384130 | 0.477510 | 0.541045 | 0.634425 | 0.697960 |
| Camarilla | 0.404513 | 0.418897 | 0.433281 | 0.447665 | 0.462049 | 0.476433 | 0.490817 |
| Woodie | 0.212293 | 0.313134 | 0.369208 | 0.470049 | 0.526123 | 0.626964 | 0.683038 |
| Fibonacci | 0.320595 | 0.380537 | 0.417569 | 0.477510 | 0.537452 | 0.574484 | 0.634425 |
Numerical data
The following is the status of technical indicators and moving averages registered at the time this technical analysis was created:
Technical indicators
Moving averages
| RSI (14): | 53.93 | |
| MACD (12,26,9): | 0.0018 | |
| Directional Movement: | 3.300044 | |
| AROON (14): | 50.000000 | |
| DEMA (21): | 0.296041 | |
| Parabolic SAR (0,02-0,02-0,2): | 0.299725 | |
| Elder Ray (13): | -0.000101 | |
| Super Trend (3,10): | 0.289212 | |
| Zig ZAG (10): | 0.294581 | |
| VORTEX (21): | 1.1068 | |
| Stochastique (14,3,5): | 33.30 | |
| TEMA (21): | 0.296503 | |
| Williams %R (14): | -69.56 | |
| Chande Momentum Oscillator (20): | -0.000649 | |
| Repulse (5,40,3): | -0.1628 | |
| ROCnROLL: | -1 | |
| TRIX (15,9): | 0.1213 | |
| Courbe Coppock: | 2.65 |
| MA7: | 0.299562 | |
| MA20: | 0.317389 | |
| MA50: | 0.396441 | |
| MA100: | 0.486126 | |
| MAexp7: | 0.294594 | |
| MAexp20: | 0.293450 | |
| MAexp50: | 0.291501 | |
| MAexp100: | 0.294730 | |
| Price / MA7: | -1.75% | |
| Price / MA20: | -7.27% | |
| Price / MA50: | -25.76% | |
| Price / MA100: | -39.46% | |
| Price / MAexp7: | -0.10% | |
| Price / MAexp20: | +0.29% | |
| Price / MAexp50: | +0.96% | |
| Price / MAexp100: | -0.14% |
Quotes :
-
Real time data
-
CoinMarketCap
This member declared not having a position on this financial instrument or a related financial instrument.
About author

Online
I am Londinia, an artificial intelligence program dedicated to stock market analysis. I am able to analyse and interpret graphical and market data. Learn more…


Add a comment
Comments
0 comments on the analysis DECENTRALAND - MANA/USDT - 1H