ZILLIQA - ZIL/USD - 1H - Technical analysis published on 12/27/2024 (GMT)
- 108
- 0
Click here for a new analysis!
- Timeframe : 1H
- - Analysis generated on
- Status : INVALID

Summary of the analysis

Additional analysis
Quotes
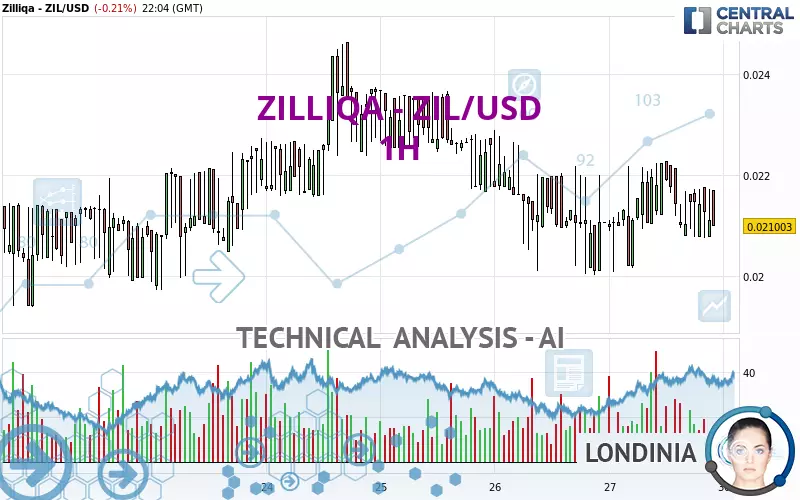
The ZILLIQA - ZIL/USD price is 0.021003 USD. The price registered a decrease of -0.21% on the session and was traded between 0.020093 USD and 0.022271 USD over the period. The price is currently at +4.53% from its lowest and -5.69% from its highest.The Central Gaps scanner detects a bearish opening. A small advantage for sellers in the very short term.
Bearish opening
Type : Bearish
Timeframe : Openning
So that you have an overall view of the price change, here is a table showing the variations over several periods:
Technical
A technical analysis in 1H of this ZILLIQA - ZIL/USD chart shows a sharp bearish trend. 92.86% of the signals given by moving averages are bearish. The overall trend is supported by the strong bearish signals from short-term moving averages. The Central Indicators scanner detects bullish signals on moving averages that could impact this trend:
Bullish price crossover with Moving Average 20
Type : Bullish
Timeframe : 1 hour
Bullish price crossover with Moving Average 50
Type : Bullish
Timeframe : 1 hour
Bullish price crossover with adaptative moving average 20
Type : Bullish
Timeframe : 1 hour
Bullish price crossover with adaptative moving average 50
Type : Bullish
Timeframe : 1 hour
On the 18 technical indicators analysed, 5 are bullish, 6 are neutral and 7 are bearish. Other results related to technical indicators were also found by the Central Indicators scanner:
MACD crosses UP its Moving Average
Type : Bullish
Timeframe : 1 hour
MACD indicator is back over 0
Type : Bullish
Timeframe : 1 hour
Momentum indicator is back under 0
Type : Bearish
Timeframe : 1 hour
The analysis of the price chart with Central Patterns scanners does not return any result.
The Central Candlesticks scanner, specialised in Japanese candlesticks, did not identify any signals.
| S3 | S2 | S1 | Price | R1 | R2 | R3 | |
|---|---|---|---|---|---|---|---|
| ProTrendLines | 0.017552 | 0.019609 | 0.020768 | 0.021003 | 0.021568 | 0.022163 | 0.022741 |
| Change (%) | -16.43% | -6.64% | -1.12% | - | +2.69% | +5.52% | +8.28% |
| Change | -0.003451 | -0.001394 | -0.000235 | - | +0.000565 | +0.001160 | +0.001738 |
| Level | Minor | Major | Minor | - | Minor | Intermediate | Minor |
To determine price objectives, it is also possible to use the pivot points. Here is the price position in relation to pivot points:
| Pivot points | S3 | S2 | S1 | PP | R1 | R2 | R3 |
|---|---|---|---|---|---|---|---|
| Standard | 0.016886 | 0.018454 | 0.019750 | 0.021318 | 0.022614 | 0.024182 | 0.025478 |
| Camarilla | 0.020259 | 0.020522 | 0.020785 | 0.021047 | 0.021310 | 0.021572 | 0.021835 |
| Woodie | 0.016751 | 0.018386 | 0.019615 | 0.021250 | 0.022479 | 0.024114 | 0.025343 |
| Fibonacci | 0.018454 | 0.019548 | 0.020224 | 0.021318 | 0.022412 | 0.023088 | 0.024182 |
| Pivot points | S3 | S2 | S1 | PP | R1 | R2 | R3 |
|---|---|---|---|---|---|---|---|
| Standard | 0.004484 | 0.011018 | 0.015716 | 0.022250 | 0.026948 | 0.033482 | 0.038180 |
| Camarilla | 0.017325 | 0.018355 | 0.019384 | 0.020414 | 0.021444 | 0.022473 | 0.023503 |
| Woodie | 0.003566 | 0.010559 | 0.014798 | 0.021791 | 0.026030 | 0.033023 | 0.037262 |
| Fibonacci | 0.011018 | 0.015309 | 0.017959 | 0.022250 | 0.026541 | 0.029191 | 0.033482 |
| Pivot points | S3 | S2 | S1 | PP | R1 | R2 | R3 |
|---|---|---|---|---|---|---|---|
| Standard | 0.003237 | 0.008447 | 0.017729 | 0.022939 | 0.032221 | 0.037431 | 0.046713 |
| Camarilla | 0.023025 | 0.024353 | 0.025682 | 0.027010 | 0.028338 | 0.029667 | 0.030995 |
| Woodie | 0.005272 | 0.009465 | 0.019764 | 0.023957 | 0.034256 | 0.038449 | 0.048748 |
| Fibonacci | 0.008447 | 0.013983 | 0.017403 | 0.022939 | 0.028475 | 0.031895 | 0.037431 |
Numerical data
The following is the status of the technical indicators and moving averages at the time of publication of this technical analysis:
| RSI (14): | 42.87 | |
| MACD (12,26,9): | -0.0001 | |
| Directional Movement: | -1.702392 | |
| AROON (14): | -57.142857 | |
| DEMA (21): | 0.021438 | |
| Parabolic SAR (0,02-0,02-0,2): | 0.021966 | |
| Elder Ray (13): | -0.000206 | |
| Super Trend (3,10): | 0.023448 | |
| Zig ZAG (10): | 0.021706 | |
| VORTEX (21): | 0.9939 | |
| Stochastique (14,3,5): | 46.87 | |
| TEMA (21): | 0.021563 | |
| Williams %R (14): | -64.47 | |
| Chande Momentum Oscillator (20): | -0.000666 | |
| Repulse (5,40,3): | 2.3591 | |
| ROCnROLL: | 2 | |
| TRIX (15,9): | 0.0106 | |
| Courbe Coppock: | 0.32 |
| MA7: | 0.021732 | |
| MA20: | 0.024779 | |
| MA50: | 0.024137 | |
| MA100: | 0.019409 | |
| MAexp7: | 0.021365 | |
| MAexp20: | 0.021344 | |
| MAexp50: | 0.021525 | |
| MAexp100: | 0.021748 | |
| Price / MA7: | -3.35% | |
| Price / MA20: | -15.24% | |
| Price / MA50: | -12.98% | |
| Price / MA100: | +8.21% | |
| Price / MAexp7: | -1.69% | |
| Price / MAexp20: | -1.60% | |
| Price / MAexp50: | -2.43% | |
| Price / MAexp100: | -3.43% |
About author
Online


Add a comment
Comments
0 comments on the analysis ZILLIQA - ZIL/USD - 1H