XBTUSD - XBTUSD/USD - 1H - Technical analysis published on 09/24/2019 (GMT)
- 187
- 0
- Who voted?
Click here for a new analysis!
- Timeframe : 1H
- - Analysis generated on
- Status : TARGET REACHED
Summary of the analysis
Additional analysis
Quotes
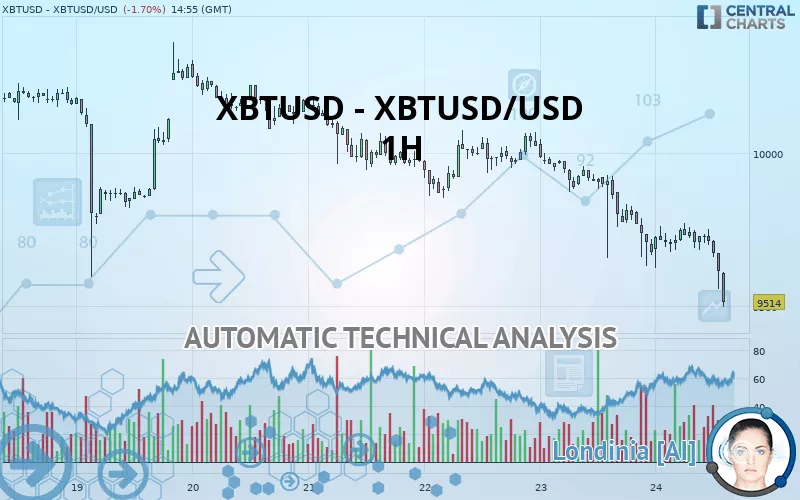
The XBTUSD - XBTUSD/USD rating is 9,514.00 USD. The price registered a decrease of -1.70% on the session and was traded between 9,497.00 USD and 9,773.00 USD over the period. The price is currently at +0.18% from its lowest and -2.65% from its highest.The Central Gaps scanner detects a bullish opening marking the presence of buyers ahead of sellers at the opening but not sufficiently marked to allow the price to register a quotation gap.
Bullish opening
Type : Bullish
Timeframe : Openning
Here is a more detailed summary of the historical variations registered by XBTUSD - XBTUSD/USD:
Near a new LOW record (1 month)
Type : Bearish
Timeframe : Weekly
Technical
Technical analysis of this 1H chart of XBTUSD - XBTUSD/USD indicates that the overall trend is strongly bearish. 92.86% of the signals given by moving averages are bearish. This strongly bearish trend is supported by the strong bearish signals given by short-term moving averages. The Central Indicators market scanner currently does not detect any result that concerns moving averages.
Technical indicators are bearish. There is still some doubt about the decline in the price.
Caution: the Central Indicators scanner currently detects an excess:
RSI indicator is oversold : under 30
Type : Neutral
Timeframe : 1 hour
CCI indicator is oversold : under -100
Type : Neutral
Timeframe : 1 hour
Pivot points : price is under support 1
Type : Neutral
Timeframe : Weekly
MACD crosses DOWN its Moving Average
Type : Bearish
Timeframe : 1 hour
Parabolic SAR indicator bearish reversal
Type : Bearish
Timeframe : 1 hour
An analysis of the price chart with the Central Patterns scanner (detector of chart patterns and resistances and supports) shows several results that can have an impact on the price change:
Near horizontal support
Type : Bullish
Timeframe : 1 hour
Support of channel is broken
Type : Bearish
Timeframe : 1 hour
The Central Candlesticks scanner which studies Japanese candlesticks did not detect anything.
| S3 | S2 | S1 | Price | R1 | R2 | R3 | |
|---|---|---|---|---|---|---|---|
| ProTrendLines | 5,111.25 | 8,212.67 | 9,442.25 | 9,514.00 | 9,596.00 | 9,657.50 | 9,854.00 |
| Change (%) | -46.28% | -13.68% | -0.75% | - | +0.86% | +1.51% | +3.57% |
| Change | -4,402.75 | -1,301.33 | -71.75 | - | +82.00 | +143.50 | +340.00 |
| Level | Minor | Minor | Major | - | Intermediate | Minor | Minor |
Pivot points can also be used to set your price objectives. Here is the price situation in relation to pivot points:
| Pivot points | S3 | S2 | S1 | PP | R1 | R2 | R3 |
|---|---|---|---|---|---|---|---|
| Standard | 9,103.00 | 9,366.50 | 9,522.50 | 9,786.00 | 9,942.00 | 10,205.50 | 10,361.50 |
| Camarilla | 9,563.14 | 9,601.59 | 9,640.05 | 9,678.50 | 9,716.95 | 9,755.41 | 9,793.86 |
| Woodie | 9,049.25 | 9,339.63 | 9,468.75 | 9,759.13 | 9,888.25 | 10,178.63 | 10,307.75 |
| Fibonacci | 9,366.50 | 9,526.75 | 9,625.75 | 9,786.00 | 9,946.25 | 10,045.25 | 10,205.50 |
| Pivot points | S3 | S2 | S1 | PP | R1 | R2 | R3 |
|---|---|---|---|---|---|---|---|
| Standard | 8,794.00 | 9,195.00 | 9,585.00 | 9,986.00 | 10,376.00 | 10,777.00 | 11,167.00 |
| Camarilla | 9,757.48 | 9,829.98 | 9,902.49 | 9,975.00 | 10,047.51 | 10,120.02 | 10,192.53 |
| Woodie | 8,788.50 | 9,192.25 | 9,579.50 | 9,983.25 | 10,370.50 | 10,774.25 | 11,161.50 |
| Fibonacci | 9,195.00 | 9,497.16 | 9,683.84 | 9,986.00 | 10,288.16 | 10,474.84 | 10,777.00 |
| Pivot points | S3 | S2 | S1 | PP | R1 | R2 | R3 |
|---|---|---|---|---|---|---|---|
| Standard | 5,510.00 | 7,423.00 | 8,513.00 | 10,426.00 | 11,516.00 | 13,429.00 | 14,519.00 |
| Camarilla | 8,777.18 | 9,052.45 | 9,327.73 | 9,603.00 | 9,878.28 | 10,153.55 | 10,428.83 |
| Woodie | 5,098.50 | 7,217.25 | 8,101.50 | 10,220.25 | 11,104.50 | 13,223.25 | 14,107.50 |
| Fibonacci | 7,423.00 | 8,570.15 | 9,278.85 | 10,426.00 | 11,573.15 | 12,281.85 | 13,429.00 |
Numerical data
The following are the details of the technical indicators and moving averages that were collected to generate this technical analysis:
| RSI (14): | 25.91 | |
| MACD (12,26,9): | -55.4800 | |
| Directional Movement: | -30.16 | |
| AROON (14): | -50.00 | |
| DEMA (21): | 9,649.43 | |
| Parabolic SAR (0,02-0,02-0,2): | 9,768.66 | |
| Elder Ray (13): | -90.94 | |
| Super Trend (3,10): | 9,773.06 | |
| Zig ZAG (10): | 9,603.00 | |
| VORTEX (21): | 0.8500 | |
| Stochastique (14,3,5): | 27.51 | |
| TEMA (21): | 9,643.12 | |
| Williams %R (14): | -74.19 | |
| Chande Momentum Oscillator (20): | -99.00 | |
| Repulse (5,40,3): | -0.4400 | |
| ROCnROLL: | 2 | |
| TRIX (15,9): | -0.0800 | |
| Courbe Coppock: | 1.09 |
| MA7: | 9,986.93 | |
| MA20: | 10,211.78 | |
| MA50: | 10,414.73 | |
| MA100: | 10,563.28 | |
| MAexp7: | 9,666.85 | |
| MAexp20: | 9,723.33 | |
| MAexp50: | 9,817.97 | |
| MAexp100: | 9,912.17 | |
| Price / MA7: | -4.74% | |
| Price / MA20: | -6.83% | |
| Price / MA50: | -8.65% | |
| Price / MA100: | -9.93% | |
| Price / MAexp7: | -1.58% | |
| Price / MAexp20: | -2.15% | |
| Price / MAexp50: | -3.10% | |
| Price / MAexp100: | -4.02% |
About author

Online


Add a comment
Comments
0 comments on the analysis XBTUSD - XBTUSD/USD - 1H