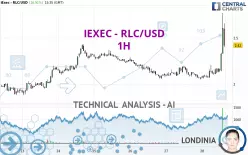
IEXEC - RLC/USD - 1H - Technical analysis published on 12/28/2024 (GMT)
- 118
- 0
Click here for a new analysis!
- Timeframe : 1H
- - Analysis generated on
- Status : TARGET REACHED

Summary of the analysis

Additional analysis
Quotes
The IEXEC - RLC/USD price is 2.42 USD. The price has increased by +16.91% since the last closing with the lowest point at 2.06 USD and the highest point at 2.77 USD. The deviation from the price is +17.48% for the low point and -12.64% for the high point.So that you have an overall view of the price change, here is a table showing the variations over several periods:
New HIGH record (1st january)
Type : Bullish
Timeframe : Weekly
Technical
Technical analysis of this 1H chart of IEXEC - RLC/USD indicates that the overall trend is strongly bullish. The signals given by the moving averages are 85.71% bullish. This strong bullish trend is confirmed by the strong signals currently being given by short-term moving averages. The Central Indicators scanner detects a bullish signal on moving averages that could impact this trend:
Moving Average bullish crossovers : AMA50 & AMA100
Type : Bullish
Timeframe : 1 hour
In fact, 17 technical indicators on 18 studied are currently positioned bullish. Caution: the Central Indicators scanner currently detects an excess:
RSI indicator is overbought : over 80
Type : Neutral
Timeframe : 1 hour
CCI indicator is overbought : over 100
Type : Neutral
Timeframe : 1 hour
Previous candle closed over Bollinger bands
Type : Neutral
Timeframe : 1 hour
Pivot points : price is over resistance 1
Type : Neutral
Timeframe : Weekly
Pivot points : price is over resistance 3
Type : Neutral
Timeframe : 1 hour
Central Patterns, the market scanner focusing on chart patterns, resistances and supports found this result:
Near horizontal resistance
Type : Bearish
Timeframe : 1 hour
The Central Candlesticks scanner which studies Japanese candlesticks did not detect anything.
| S3 | S2 | S1 | Price | R1 | R2 | R3 | |
|---|---|---|---|---|---|---|---|
| ProTrendLines | 2.12 | 2.20 | 2.27 | 2.42 | 2.43 | 2.63 | 2.90 |
| Change (%) | -12.40% | -9.09% | -6.20% | - | +0.41% | +8.68% | +19.83% |
| Change | -0.30 | -0.22 | -0.15 | - | +0.01 | +0.21 | +0.48 |
| Level | Minor | Intermediate | Major | - | Minor | Minor | Major |
Pivot points can also be used to set your price objectives. Here is the price situation in relation to pivot points:
| Pivot points | S3 | S2 | S1 | PP | R1 | R2 | R3 |
|---|---|---|---|---|---|---|---|
| Standard | 1.86 | 1.96 | 2.01 | 2.11 | 2.16 | 2.26 | 2.31 |
| Camarilla | 2.03 | 2.04 | 2.06 | 2.07 | 2.08 | 2.10 | 2.11 |
| Woodie | 1.85 | 1.95 | 2.00 | 2.10 | 2.15 | 2.25 | 2.30 |
| Fibonacci | 1.96 | 2.01 | 2.05 | 2.11 | 2.16 | 2.20 | 2.26 |
| Pivot points | S3 | S2 | S1 | PP | R1 | R2 | R3 |
|---|---|---|---|---|---|---|---|
| Standard | 0.53 | 1.10 | 1.51 | 2.08 | 2.49 | 3.06 | 3.47 |
| Camarilla | 1.66 | 1.75 | 1.84 | 1.93 | 2.02 | 2.11 | 2.20 |
| Woodie | 0.46 | 1.06 | 1.44 | 2.04 | 2.42 | 3.02 | 3.40 |
| Fibonacci | 1.10 | 1.47 | 1.70 | 2.08 | 2.45 | 2.68 | 3.06 |
| Pivot points | S3 | S2 | S1 | PP | R1 | R2 | R3 |
|---|---|---|---|---|---|---|---|
| Standard | 0.86 | 1.20 | 1.81 | 2.15 | 2.76 | 3.10 | 3.71 |
| Camarilla | 2.16 | 2.25 | 2.33 | 2.42 | 2.51 | 2.59 | 2.68 |
| Woodie | 1.00 | 1.27 | 1.95 | 2.22 | 2.90 | 3.17 | 3.85 |
| Fibonacci | 1.20 | 1.56 | 1.79 | 2.15 | 2.51 | 2.74 | 3.10 |
Numerical data
The following are the details of the technical indicators and moving averages that were collected to generate this technical analysis:
| RSI (14): | 80.50 | |
| MACD (12,26,9): | 0.0800 | |
| Directional Movement: | 56.51 | |
| AROON (14): | 92.86 | |
| DEMA (21): | 2.32 | |
| Parabolic SAR (0,02-0,02-0,2): | 2.14 | |
| Elder Ray (13): | 0.34 | |
| Super Trend (3,10): | 2.34 | |
| Zig ZAG (10): | 2.64 | |
| VORTEX (21): | 1.3400 | |
| Stochastique (14,3,5): | 84.63 | |
| TEMA (21): | 2.40 | |
| Williams %R (14): | -18.57 | |
| Chande Momentum Oscillator (20): | 0.54 | |
| Repulse (5,40,3): | 11.4000 | |
| ROCnROLL: | 1 | |
| TRIX (15,9): | 0.1700 | |
| Courbe Coppock: | 24.37 |
| MA7: | 2.21 | |
| MA20: | 2.27 | |
| MA50: | 2.18 | |
| MA100: | 1.87 | |
| MAexp7: | 2.37 | |
| MAexp20: | 2.23 | |
| MAexp50: | 2.18 | |
| MAexp100: | 2.16 | |
| Price / MA7: | +9.50% | |
| Price / MA20: | +6.61% | |
| Price / MA50: | +11.01% | |
| Price / MA100: | +29.41% | |
| Price / MAexp7: | +2.11% | |
| Price / MAexp20: | +8.52% | |
| Price / MAexp50: | +11.01% | |
| Price / MAexp100: | +12.04% |
About author
Online


Add a comment
Comments
0 comments on the analysis IEXEC - RLC/USD - 1H