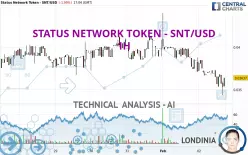
STATUS - SNT/USD - 1H - Technical analysis published on 02/02/2025 (GMT)
- 117
- 0
Click here for a new analysis!
- Timeframe : 1H
- - Analysis generated on
- Status : TARGET REACHED

Summary of the analysis

Additional analysis
Quotes
The STATUS NETWORK TOKEN - SNT/USD rating is 0.036370 USD. On the day, this instrument lost -1.99% and was traded between 0.034334 USD and 0.038469 USD over the period. The price is currently at +5.93% from its lowest and -5.46% from its highest.A bearish opening was detected by the Central Gaps scanner. Sellers are trying to impose a bearish trend in the very short term.
Bullish opening
Type : Bullish
Timeframe : Openning
Bearish opening
Type : Bearish
Timeframe : Openning
So that you have an overall view of the price change, here is a table showing the variations over several periods:
New LOW record (1st january)
Type : Bearish
Timeframe : Weekly
New LOW record (1 month)
Type : Bearish
Timeframe : Weekly
Technical
A technical analysis in 1H of this STATUS NETWORK TOKEN - SNT/USD chart shows a sharp bearish trend. 92.86% of the signals given by moving averages are bearish. This strongly bearish trend is supported by the strong bearish signals given by short-term moving averages. The Central Indicators market scanner is currently detecting several bullish signals that could impact this trend:
Bullish price crossover with Moving Average 20
Type : Bullish
Timeframe : 1 hour
Bullish price crossover with Moving Average 50
Type : Bullish
Timeframe : 1 hour
Bullish price crossover with adaptative moving average 100
Type : Bullish
Timeframe : 1 hour
Technical indicators are slightly bearish. There is therefore considerable uncertainty about the continuation of the decline.
But beware of excesses. The Central Indicators scanner currently detects this:
CCI indicator is oversold : under -100
Type : Neutral
Timeframe : 1 hour
An analysis of the price chart with the Central Patterns scanner (detector of chart patterns and resistances and supports) shows a result that can have an impact on the price change:
Near support of triangle
Type : Bullish
Timeframe : 1 hour
For a small rebound in the very short term, the Central Candlesticks scanner currently notes the presence of these bullish patterns in Japanese candlesticks:
Bullish harami
Type : Bullish
Timeframe : 1 hour
Bullish harami cross
Type : Bullish
Timeframe : 1 hour
| S3 | S2 | S1 | Price | R1 | R2 | R3 | |
|---|---|---|---|---|---|---|---|
| ProTrendLines | 0.018169 | 0.022816 | 0.027390 | 0.036370 | 0.036725 | 0.037397 | 0.038498 |
| Change (%) | -50.04% | -37.27% | -24.69% | - | +0.98% | +2.82% | +5.85% |
| Change | -0.018201 | -0.013554 | -0.008980 | - | +0.000355 | +0.001027 | +0.002128 |
| Level | Major | Minor | Intermediate | - | Intermediate | Major | Intermediate |
To determine price objectives, it is also possible to use the pivot points. Here is the price position in relation to pivot points:
| Pivot points | S3 | S2 | S1 | PP | R1 | R2 | R3 |
|---|---|---|---|---|---|---|---|
| Standard | 0.027923 | 0.032517 | 0.034813 | 0.039407 | 0.041703 | 0.046297 | 0.048593 |
| Camarilla | 0.035215 | 0.035847 | 0.036478 | 0.037110 | 0.037742 | 0.038373 | 0.039005 |
| Woodie | 0.026775 | 0.031943 | 0.033665 | 0.038833 | 0.040555 | 0.045723 | 0.047445 |
| Fibonacci | 0.032517 | 0.035149 | 0.036775 | 0.039407 | 0.042039 | 0.043665 | 0.046297 |
| Pivot points | S3 | S2 | S1 | PP | R1 | R2 | R3 |
|---|---|---|---|---|---|---|---|
| Standard | 0.026868 | 0.031673 | 0.034391 | 0.039196 | 0.041914 | 0.046719 | 0.049437 |
| Camarilla | 0.035041 | 0.035731 | 0.036420 | 0.037110 | 0.037800 | 0.038489 | 0.039179 |
| Woodie | 0.025826 | 0.031151 | 0.033349 | 0.038674 | 0.040872 | 0.046197 | 0.048395 |
| Fibonacci | 0.031673 | 0.034547 | 0.036322 | 0.039196 | 0.042070 | 0.043845 | 0.046719 |
| Pivot points | S3 | S2 | S1 | PP | R1 | R2 | R3 |
|---|---|---|---|---|---|---|---|
| Standard | 0.017208 | 0.026842 | 0.033333 | 0.042967 | 0.049458 | 0.059092 | 0.065583 |
| Camarilla | 0.035389 | 0.036867 | 0.038345 | 0.039823 | 0.041301 | 0.042779 | 0.044257 |
| Woodie | 0.015636 | 0.026056 | 0.031761 | 0.042181 | 0.047886 | 0.058306 | 0.064011 |
| Fibonacci | 0.026842 | 0.033002 | 0.036808 | 0.042967 | 0.049127 | 0.052933 | 0.059092 |
Numerical data
The following is the status of the technical indicators and moving averages at the time of publication of this technical analysis:
| RSI (14): | 34.18 | |
| MACD (12,26,9): | -0.0008 | |
| Directional Movement: | -35.739120 | |
| AROON (14): | -50.000000 | |
| DEMA (21): | 0.035783 | |
| Parabolic SAR (0,02-0,02-0,2): | 0.036700 | |
| Elder Ray (13): | -0.000838 | |
| Super Trend (3,10): | 0.037388 | |
| Zig ZAG (10): | 0.035418 | |
| VORTEX (21): | 0.8106 | |
| Stochastique (14,3,5): | 27.14 | |
| TEMA (21): | 0.035498 | |
| Williams %R (14): | -62.81 | |
| Chande Momentum Oscillator (20): | -0.001410 | |
| Repulse (5,40,3): | -1.7030 | |
| ROCnROLL: | 2 | |
| TRIX (15,9): | -0.2709 | |
| Courbe Coppock: | 8.03 |
| MA7: | 0.038556 | |
| MA20: | 0.041763 | |
| MA50: | 0.043772 | |
| MA100: | 0.042014 | |
| MAexp7: | 0.035950 | |
| MAexp20: | 0.036940 | |
| MAexp50: | 0.037991 | |
| MAexp100: | 0.038640 | |
| Price / MA7: | -5.67% | |
| Price / MA20: | -12.91% | |
| Price / MA50: | -16.91% | |
| Price / MA100: | -13.43% | |
| Price / MAexp7: | +1.17% | |
| Price / MAexp20: | -1.54% | |
| Price / MAexp50: | -4.27% | |
| Price / MAexp100: | -5.87% |
About author
Online


Add a comment
Comments
0 comments on the analysis STATUS - SNT/USD - 1H