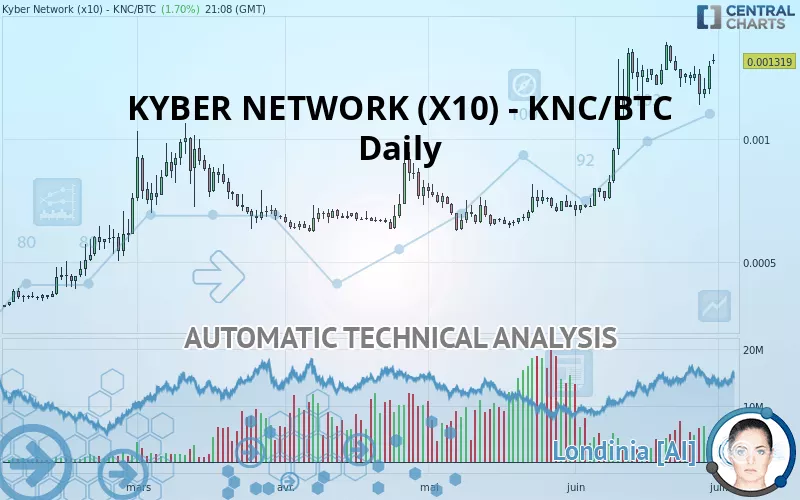
KYBER NETWORK CRYSTAL V2 (X10) - KNC/BTC - Daily - Technical analysis published on 06/30/2020 (GMT)
- 216
- 0
- Who voted?
Click here for a new analysis!
- Timeframe : Daily
- - Analysis generated on
- Status : TARGET REACHED

Summary of the analysis

Additional analysis
Quotes
The KYBER NETWORK (X10) - KNC/BTC price is 0.001319 BTC. The price registered an increase of +1.70% on the session and was traded between 0.001305 BTC and 0.001349 BTC over the period. The price is currently at +1.07% from its lowest and -2.22% from its highest.A bullish gap was detected at the opening by the Central Gaps scanner. There are a lot of buyers and they have the upper hand in the very short term.
Opening Gap UP
Type : Bullish
Timeframe : Openning
A study of price movements over other periods shows the following variations:
Near a new HIGH record (1st january)
Type : Bullish
Timeframe : Weekly
Near a new HIGH record (1 month)
Type : Bullish
Timeframe : Weekly
The Central Volumes scanner notes the presence of abnormal volumes:
Abnormal volumes
Timeframe : 50 days
Technical
A technical analysis in Daily of this KYBER NETWORK (X10) - KNC/BTC chart shows a strongly bullish trend. 92.86% of the signals given by moving averages are bullish. This strongly bullish trend is supported by the strong bullish signals given by short-term moving averages. The Central Indicators scanner detects bullish signals on moving averages that could impact this trend:
Bullish price crossover with Moving Average 20
Type : Bullish
Timeframe : Daily
Bullish price crossover with adaptative moving average 20
Type : Bullish
Timeframe : Daily
In fact, according to the parameters integrated into the Central Analyzer system, 11 technical indicators out of 18 analysed are currently bullish. But beware of excesses. The Central Indicators scanner currently detects this:
Williams %R indicator is overbought : over -20
Type : Neutral
Timeframe : Daily
Price is back over the pivot point
Type : Bullish
Timeframe : Daily
Price is back under the pivot point
Type : Bearish
Timeframe : Weekly
Momentum indicator is back over 0
Type : Bullish
Timeframe : Daily
Williams %R indicator is back over -50
Type : Bullish
Timeframe : Daily
The Central Patterns scanner, which studies chart patterns, resistances and supports, has identified this signal:
Horizontal support is broken
Type : Bearish
Timeframe : Daily
The Central Candlesticks scanner, specialised in Japanese candlesticks, did not identify any signals.
| S3 | S2 | S1 | Price | R1 | R2 | R3 | |
|---|---|---|---|---|---|---|---|
| ProTrendLines | 0.000906 | 0.001003 | 0.001222 | 0.001319 | 0.001382 | 0.003000 | 0.004263 |
| Change (%) | -31.31% | -23.96% | -7.35% | - | +4.78% | +127.45% | +223.20% |
| Change | -0.000413 | -0.000316 | -0.000097 | - | +0.000063 | +0.001681 | +0.002944 |
| Level | Major | Intermediate | Intermediate | - | Major | Minor | Intermediate |
To determine price objectives, it is also possible to use the pivot points. Here is the price position in relation to pivot points:
| Pivot points | S3 | S2 | S1 | PP | R1 | R2 | R3 |
|---|---|---|---|---|---|---|---|
| Standard | 0.001085 | 0.001136 | 0.001216 | 0.001267 | 0.001347 | 0.001398 | 0.001478 |
| Camarilla | 0.001261 | 0.001273 | 0.001285 | 0.001297 | 0.001309 | 0.001321 | 0.001333 |
| Woodie | 0.001101 | 0.001143 | 0.001232 | 0.001274 | 0.001363 | 0.001405 | 0.001494 |
| Fibonacci | 0.001136 | 0.001186 | 0.001217 | 0.001267 | 0.001317 | 0.001348 | 0.001398 |
| Pivot points | S3 | S2 | S1 | PP | R1 | R2 | R3 |
|---|---|---|---|---|---|---|---|
| Standard | 0.000843 | 0.000991 | 0.001088 | 0.001236 | 0.001333 | 0.001481 | 0.001578 |
| Camarilla | 0.001118 | 0.001140 | 0.001163 | 0.001185 | 0.001208 | 0.001230 | 0.001252 |
| Woodie | 0.000818 | 0.000978 | 0.001063 | 0.001223 | 0.001308 | 0.001468 | 0.001553 |
| Fibonacci | 0.000991 | 0.001085 | 0.001142 | 0.001236 | 0.001330 | 0.001387 | 0.001481 |
| Pivot points | S3 | S2 | S1 | PP | R1 | R2 | R3 |
|---|---|---|---|---|---|---|---|
| Standard | 0.000434 | 0.000531 | 0.000630 | 0.000727 | 0.000826 | 0.000923 | 0.001022 |
| Camarilla | 0.000676 | 0.000694 | 0.000712 | 0.000730 | 0.000748 | 0.000766 | 0.000784 |
| Woodie | 0.000436 | 0.000532 | 0.000632 | 0.000728 | 0.000828 | 0.000924 | 0.001024 |
| Fibonacci | 0.000531 | 0.000606 | 0.000652 | 0.000727 | 0.000802 | 0.000848 | 0.000923 |
Numerical data
The following are the details of the technical indicators and moving averages that were collected to generate this technical analysis:
| RSI (14): | 63.16 | |
| MACD (12,26,9): | 0.0001 | |
| Directional Movement: | 12.981234 | |
| AROON (14): | -49.999998 | |
| DEMA (21): | 0.001332 | |
| Parabolic SAR (0,02-0,02-0,2): | 0.001381 | |
| Elder Ray (13): | 0.000082 | |
| Super Trend (3,10): | 0.001064 | |
| Zig ZAG (10): | 0.001306 | |
| VORTEX (21): | 1.2032 | |
| Stochastique (14,3,5): | 50.97 | |
| TEMA (21): | 0.001326 | |
| Williams %R (14): | -35.02 | |
| Chande Momentum Oscillator (20): | 0.000086 | |
| Repulse (5,40,3): | 1.6358 | |
| ROCnROLL: | 1 | |
| TRIX (15,9): | 1.6036 | |
| Courbe Coppock: | 5.65 |
| MA7: | 0.001253 | |
| MA20: | 0.001266 | |
| MA50: | 0.000953 | |
| MA100: | 0.000828 | |
| MAexp7: | 0.001265 | |
| MAexp20: | 0.001204 | |
| MAexp50: | 0.001034 | |
| MAexp100: | 0.000883 | |
| Price / MA7: | +5.27% | |
| Price / MA20: | +4.19% | |
| Price / MA50: | +38.41% | |
| Price / MA100: | +59.30% | |
| Price / MAexp7: | +4.27% | |
| Price / MAexp20: | +9.55% | |
| Price / MAexp50: | +27.56% | |
| Price / MAexp100: | +49.38% |
About author

Online


Add a comment
Comments
0 comments on the analysis KYBER NETWORK CRYSTAL V2 (X10) - KNC/BTC - Daily