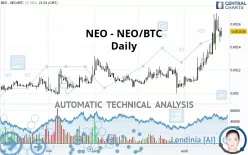
NEO - NEO/BTC - Daily - Technical analysis published on 08/26/2020 (GMT)
- 231
- 0
- Who voted?
Click here for a new analysis!
- Timeframe : Daily
- - Analysis generated on
- Status : TARGET REACHED

Summary of the analysis

Additional analysis
Quotes
The NEO - NEO/BTC rating is 0.001536 BTC. The price has increased by +2.74% since the last closing and was between 0.001484 BTC and 0.001569 BTC. This implies that the price is at +3.50% from its lowest and at -2.10% from its highest.The Central Gaps scanner detects a bullish opening marking the presence of buyers ahead of sellers at the opening but not sufficiently marked to allow the price to register a quotation gap.
Bullish opening
Type : Bullish
Timeframe : Openning
Here is a more detailed summary of the historical variations registered by NEO - NEO/BTC:
Technical
Technical analysis of NEO - NEO/BTC in Daily shows a strongly overall bullish trend. 92.86% of the signals given by moving averages are bullish. The overall trend is supported by the strong bullish signals from short-term moving averages. There is no crossing of moving average by the price or crossing of moving averages between themselves.
In fact, 14 technical indicators on 18 studied are currently positioned bullish. But beware of excesses. The Central Indicators scanner currently detects this:
Williams %R indicator is overbought : over -20
Type : Neutral
Timeframe : Daily
Price is back over the pivot point
Type : Bullish
Timeframe : Weekly
Price is back under the pivot point
Type : Bearish
Timeframe : Daily
Central Patterns, the market scanner focusing on chart patterns, resistances and supports found these results:
Horizontal resistance is broken
Type : Bullish
Timeframe : Daily
Resistance of channel is broken
Type : Bullish
Timeframe : Daily
The Central Candlesticks scanner which studies Japanese candlesticks did not detect anything.
| S3 | S2 | S1 | Price | R1 | R2 | R3 | |
|---|---|---|---|---|---|---|---|
| ProTrendLines | 0.001213 | 0.001281 | 0.001356 | 0.001536 | 0.001617 | 0.002648 | 0.006731 |
| Change (%) | -21.03% | -16.60% | -11.72% | - | +5.27% | +72.40% | +338.22% |
| Change | -0.000323 | -0.000255 | -0.000180 | - | +0.000081 | +0.001112 | +0.005195 |
| Level | Minor | Minor | Major | - | Intermediate | Minor | Minor |
To determine price objectives, it is also possible to use the pivot points. Here is the price position in relation to pivot points:
| Pivot points | S3 | S2 | S1 | PP | R1 | R2 | R3 |
|---|---|---|---|---|---|---|---|
| Standard | 0.001311 | 0.001377 | 0.001436 | 0.001502 | 0.001561 | 0.001627 | 0.001686 |
| Camarilla | 0.001461 | 0.001472 | 0.001484 | 0.001495 | 0.001507 | 0.001518 | 0.001529 |
| Woodie | 0.001308 | 0.001375 | 0.001433 | 0.001500 | 0.001558 | 0.001625 | 0.001683 |
| Fibonacci | 0.001377 | 0.001425 | 0.001454 | 0.001502 | 0.001550 | 0.001579 | 0.001627 |
| Pivot points | S3 | S2 | S1 | PP | R1 | R2 | R3 |
|---|---|---|---|---|---|---|---|
| Standard | 0.000913 | 0.001080 | 0.001353 | 0.001520 | 0.001793 | 0.001960 | 0.002233 |
| Camarilla | 0.001505 | 0.001545 | 0.001586 | 0.001626 | 0.001666 | 0.001707 | 0.001747 |
| Woodie | 0.000966 | 0.001107 | 0.001406 | 0.001547 | 0.001846 | 0.001987 | 0.002286 |
| Fibonacci | 0.001080 | 0.001248 | 0.001352 | 0.001520 | 0.001688 | 0.001792 | 0.001960 |
| Pivot points | S3 | S2 | S1 | PP | R1 | R2 | R3 |
|---|---|---|---|---|---|---|---|
| Standard | 0.000730 | 0.000861 | 0.000967 | 0.001098 | 0.001204 | 0.001335 | 0.001441 |
| Camarilla | 0.001007 | 0.001029 | 0.001050 | 0.001072 | 0.001094 | 0.001115 | 0.001137 |
| Woodie | 0.000717 | 0.000855 | 0.000954 | 0.001092 | 0.001191 | 0.001329 | 0.001428 |
| Fibonacci | 0.000861 | 0.000952 | 0.001008 | 0.001098 | 0.001189 | 0.001245 | 0.001335 |
Numerical data
The following are the details of the technical indicators and moving averages that were collected to generate this technical analysis:
| RSI (14): | 65.62 | |
| MACD (12,26,9): | 0.0001 | |
| Directional Movement: | 16.816654 | |
| AROON (14): | 78.571426 | |
| DEMA (21): | 0.001504 | |
| Parabolic SAR (0,02-0,02-0,2): | 0.001443 | |
| Elder Ray (13): | 0.000090 | |
| Super Trend (3,10): | 0.001235 | |
| Zig ZAG (10): | 0.001537 | |
| VORTEX (21): | 1.1664 | |
| Stochastique (14,3,5): | 66.16 | |
| TEMA (21): | 0.001570 | |
| Williams %R (14): | -31.40 | |
| Chande Momentum Oscillator (20): | 0.000275 | |
| Repulse (5,40,3): | -2.2558 | |
| ROCnROLL: | 1 | |
| TRIX (15,9): | 1.0056 | |
| Courbe Coppock: | 53.37 |
| MA7: | 0.001525 | |
| MA20: | 0.001340 | |
| MA50: | 0.001220 | |
| MA100: | 0.001177 | |
| MAexp7: | 0.001497 | |
| MAexp20: | 0.001379 | |
| MAexp50: | 0.001263 | |
| MAexp100: | 0.001206 | |
| Price / MA7: | +0.72% | |
| Price / MA20: | +14.63% | |
| Price / MA50: | +25.90% | |
| Price / MA100: | +30.50% | |
| Price / MAexp7: | +2.61% | |
| Price / MAexp20: | +11.39% | |
| Price / MAexp50: | +21.62% | |
| Price / MAexp100: | +27.36% |
About author

Online


Add a comment
Comments
0 comments on the analysis NEO - NEO/BTC - Daily