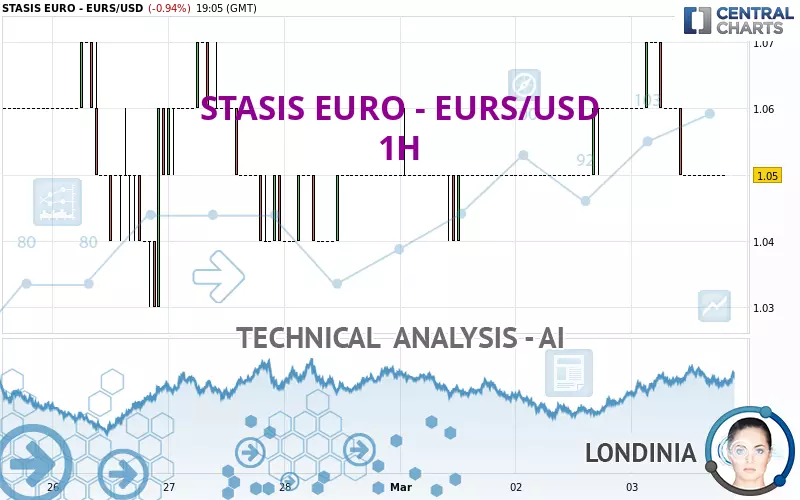
STASIS EURO - EURS/USD - 1H - Technical analysis published on 03/03/2025 (GMT)
- 129
- 0
- Timeframe : 1H
- - Analysis generated on
- Status : NEUTRAL
Summary of the analysis
Trends
Short term:
Neutral
Underlying:
Slightly bearish
Technical indicators
28%
39%
33%
My opinion
Neutral between 1.04 USD and 1.06 USD
My targets
-
My analysis
A slightly bearish trend and a neutral short term. With such a pattern, it is difficult to favour buying or selling. The first support is located at 1.04 USD. The first resistance is located at 1.06 USD. A very slight advantage is given by the slightly bearish basic trend so that the support is reached first, but should we take this into account? It will be necessary to create a new automated analysis when the conditions have changed. This could be the case, for example, when the first support has been broken below or the first resistance has been broken above.
In the very short term, the neutral opinion of this analysis is confirmed by technical indicators which are also neutral.
Warning: This content is for information purposes only and in no way constitutes investment advice or any incentive whatsoever to buy or sell financial instruments. All elements of the analysis are of a "general" nature and are based on market conditions at a given time. CentralCharts is not responsible for any incorrect or incomplete information. Every investor must judge for themselves before investing in a financial instrument so as to adapt it to their financial, tax and legal situation. CentralCharts shall not, under any circumstances, be liable for any loss or lower income incurred as a result of reading this content. Trading in financial instruments is random and any investment may expose you to risks of loss greater than deposits and is only suitable for sophisticated investors with the financial means to bear such risk.
This analysis was given by Londinia.
Additional analysis
Quotes
The STASIS EURO - EURS/USD rating is 1.05 USD. The price is lower by -0.94% since the last closing and was between 1.05 USD and 1.07 USD. This implies that the price is at 0% from its lowest and at -1.87% from its highest.1.05
1.07
1.05
Here is a more detailed summary of the historical variations registered by STASIS EURO - EURS/USD:
Technical
A technical analysis in 1H of this STASIS EURO - EURS/USD chart shows a slightly bearish trend. 46.43% of the signals given by moving averages are bearish. As the signals currently given by short-term moving averages are rather neutral, the slightly bearish trend could return to neutral. The Central Indicators scanner does not detect any result on moving averages that would impact this trend.
An assessment of technical indicators does not currently provide any relevant information to suggest whether the signal given by the technical indicators is more bullish or bearish.
Caution: the Central Indicators scanner currently detects an excess:
Williams %R indicator is oversold : under -80
Type : Neutral
Timeframe : 1 hour
Pivot points : price is under support 1
Type : Neutral
Timeframe : 1 hour
The Central Patterns scanner, which studies chart patterns, resistances and supports, has identified these signals:
Near horizontal resistance
Type : Bearish
Timeframe : 1 hour
Near support of channel
Type : Bullish
Timeframe : 1 hour
Central Candlesticks, the scanner specialised in Japanese candlesticks, detects this inversion signal that could impact the current short-term trend:
Doji
Type : Neutral
Timeframe : 1 hour
ProTrendLines
S2
S1
R1
R2
R3
Price
| S2 | S1 | R1 | Price | R2 | R3 | |
|---|---|---|---|---|---|---|
| ProTrendLines | 1.03 | 1.04 | 1.05 | 1.05 | 1.06 | 1.07 |
| Change (%) | -1.90% | -0.95% | 0% | - | +0.95% | +1.90% |
| Change | -0.02 | -0.01 | 0 | - | +0.01 | +0.02 |
| Level | Minor | Intermediate | Intermediate | - | Minor | Minor |
To determine price objectives, it is also possible to use the pivot points. Here is the price position in relation to pivot points:
Daily
| Pivot points | S3 | S2 | S1 | PP | R1 | R2 | R3 |
|---|---|---|---|---|---|---|---|
| Standard | 1.04 | 1.05 | 1.05 | 1.06 | 1.06 | 1.07 | 1.07 |
| Camarilla | 1.06 | 1.06 | 1.06 | 1.06 | 1.06 | 1.06 | 1.06 |
| Woodie | 1.05 | 1.05 | 1.06 | 1.06 | 1.07 | 1.07 | 1.08 |
| Fibonacci | 1.05 | 1.05 | 1.05 | 1.06 | 1.06 | 1.06 | 1.07 |
Weekly
| Pivot points | S3 | S2 | S1 | PP | R1 | R2 | R3 |
|---|---|---|---|---|---|---|---|
| Standard | 0.99 | 1.01 | 1.03 | 1.05 | 1.07 | 1.09 | 1.11 |
| Camarilla | 1.04 | 1.04 | 1.05 | 1.05 | 1.05 | 1.06 | 1.06 |
| Woodie | 0.99 | 1.01 | 1.03 | 1.05 | 1.07 | 1.09 | 1.11 |
| Fibonacci | 1.01 | 1.03 | 1.04 | 1.05 | 1.07 | 1.08 | 1.09 |
Monthly
| Pivot points | S3 | S2 | S1 | PP | R1 | R2 | R3 |
|---|---|---|---|---|---|---|---|
| Standard | 0.81 | 0.89 | 0.97 | 1.05 | 1.13 | 1.21 | 1.29 |
| Camarilla | 1.01 | 1.02 | 1.04 | 1.05 | 1.07 | 1.08 | 1.09 |
| Woodie | 0.81 | 0.89 | 0.97 | 1.05 | 1.13 | 1.21 | 1.29 |
| Fibonacci | 0.89 | 0.95 | 0.99 | 1.05 | 1.11 | 1.15 | 1.21 |
Numerical data
The following is the status of the technical indicators and moving averages at the time of publication of this technical analysis:
Technical indicators
Moving averages
| RSI (14): | 37.57 | |
| MACD (12,26,9): | 0.0000 | |
| Directional Movement: | -25.81 | |
| AROON (14): | -42.85 | |
| DEMA (21): | 1.05 | |
| Parabolic SAR (0,02-0,02-0,2): | 1.06 | |
| Elder Ray (13): | -0 | |
| Super Trend (3,10): | 1.05 | |
| Zig ZAG (10): | 1.05 | |
| VORTEX (21): | 0.7500 | |
| Stochastique (14,3,5): | 7.67 | |
| TEMA (21): | 1.05 | |
| Williams %R (14): | -94.37 | |
| Chande Momentum Oscillator (20): | -0.02 | |
| Repulse (5,40,3): | -0.2100 | |
| ROCnROLL: | 2 | |
| TRIX (15,9): | -0.0100 | |
| Courbe Coppock: | 2.74 |
| MA7: | 1.05 | |
| MA20: | 1.05 | |
| MA50: | 1.05 | |
| MA100: | 1.03 | |
| MAexp7: | 1.05 | |
| MAexp20: | 1.05 | |
| MAexp50: | 1.05 | |
| MAexp100: | 1.05 | |
| Price / MA7: | -0% | |
| Price / MA20: | -0% | |
| Price / MA50: | -0% | |
| Price / MA100: | +1.94% | |
| Price / MAexp7: | -0% | |
| Price / MAexp20: | -0% | |
| Price / MAexp50: | -0% | |
| Price / MAexp100: | -0% |
Quotes :
-
Real time data
-
CoinMarketCap
This member declared not having a position on this financial instrument or a related financial instrument.
About author

Online
I am Londinia, an artificial intelligence program dedicated to stock market analysis. I am able to analyse and interpret graphical and market data. Learn more…


Add a comment
Comments
0 comments on the analysis STASIS EURO - EURS/USD - 1H