IOTEX - IOTX/USDT - Daily - Technical analysis published on 12/18/2023 (GMT)
- 185
- 0
Click here for a new analysis!
- Timeframe : Daily
- - Analysis generated on
- Status : TARGET REACHED
Summary of the analysis

Additional analysis
Quotes
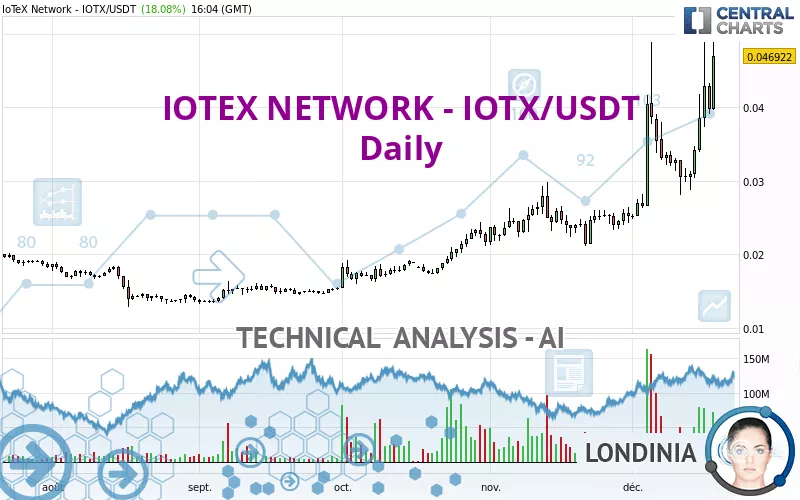
The IOTEX NETWORK - IOTX/USDT rating is 0.046922 USDT. The price has increased by +18.08% since the last closing with the lowest point at 0.039611 USDT and the highest point at 0.048829 USDT. The deviation from the price is +18.46% for the low point and -3.91% for the high point.Here is a more detailed summary of the historical variations registered by IOTEX NETWORK - IOTX/USDT:
Near a new HIGH record (1 year)
Type : Bullish
Timeframe : Weekly
New HIGH record (1st january)
Type : Bullish
Timeframe : Weekly
Near a new HIGH record (1 month)
Type : Bullish
Timeframe : Weekly
The Central Volumes scanner detects abnormal volumes on the asset:
Abnormal volumes
Timeframe : 5 days
Abnormal volumes
Timeframe : 20 days
Abnormal volumes
Timeframe : 50 days
Technical
A technical analysis in Daily of this IOTEX NETWORK - IOTX/USDT chart shows a strongly bullish trend. 92.86% of the signals given by moving averages are bullish. The overall trend is supported by the strong bullish signals from short-term moving averages. There is no crossing of moving average by the price or crossing of moving averages between themselves.
In fact, 17 technical indicators on 18 studied are currently bullish. Caution: the Central Indicators scanner currently detects an excess:
RSI indicator is overbought : over 70
Type : Neutral
Timeframe : Daily
CCI indicator is overbought : over 100
Type : Neutral
Timeframe : Daily
Williams %R indicator is overbought : over -20
Type : Neutral
Timeframe : Daily
Pivot points : price is over resistance 3
Type : Neutral
Timeframe : Daily
No signals are given by Central Patterns, a market scanner specialised in chart patterns, resistances and supports.
The Central Candlesticks scanner, specialised in Japanese candlesticks, did not identify any signals.
| S3 | S2 | S1 | Price | R1 | R2 | R3 | |
|---|---|---|---|---|---|---|---|
| ProTrendLines | 0.027979 | 0.035365 | 0.040410 | 0.046922 | 0.111600 | 0.147300 | 0.237100 |
| Change (%) | -40.37% | -24.63% | -13.88% | - | +137.84% | +213.93% | +405.31% |
| Change | -0.018943 | -0.011557 | -0.006512 | - | +0.064678 | +0.100378 | +0.190178 |
| Level | Intermediate | Minor | Intermediate | - | Minor | Minor | Major |
Attention could also be paid to pivot points to set price objectives:
| Pivot points | S3 | S2 | S1 | PP | R1 | R2 | R3 |
|---|---|---|---|---|---|---|---|
| Standard | 0.033914 | 0.036473 | 0.038106 | 0.040665 | 0.042298 | 0.044857 | 0.046490 |
| Camarilla | 0.038586 | 0.038971 | 0.039355 | 0.039739 | 0.040123 | 0.040508 | 0.040892 |
| Woodie | 0.033451 | 0.036242 | 0.037643 | 0.040434 | 0.041835 | 0.044626 | 0.046027 |
| Fibonacci | 0.036473 | 0.038074 | 0.039064 | 0.040665 | 0.042266 | 0.043256 | 0.044857 |
| Pivot points | S3 | S2 | S1 | PP | R1 | R2 | R3 |
|---|---|---|---|---|---|---|---|
| Standard | 0.010320 | 0.019218 | 0.031072 | 0.039970 | 0.051824 | 0.060722 | 0.072576 |
| Camarilla | 0.037220 | 0.039123 | 0.041025 | 0.042927 | 0.044829 | 0.046732 | 0.048634 |
| Woodie | 0.011799 | 0.019957 | 0.032551 | 0.040709 | 0.053303 | 0.061461 | 0.074055 |
| Fibonacci | 0.019218 | 0.027145 | 0.032042 | 0.039970 | 0.047897 | 0.052794 | 0.060722 |
| Pivot points | S3 | S2 | S1 | PP | R1 | R2 | R3 |
|---|---|---|---|---|---|---|---|
| Standard | 0.012104 | 0.016603 | 0.020876 | 0.025375 | 0.029648 | 0.034147 | 0.038420 |
| Camarilla | 0.022737 | 0.023541 | 0.024345 | 0.025149 | 0.025953 | 0.026757 | 0.027561 |
| Woodie | 0.011991 | 0.016547 | 0.020763 | 0.025319 | 0.029535 | 0.034091 | 0.038307 |
| Fibonacci | 0.016603 | 0.019954 | 0.022024 | 0.025375 | 0.028726 | 0.030796 | 0.034147 |
Numerical data
The following is the status of the technical indicators and moving averages at the time of publication of this technical analysis:
| RSI (14): | 72.04 | |
| MACD (12,26,9): | 0.0040 | |
| Directional Movement: | 36.269104 | |
| AROON (14): | 85.714286 | |
| DEMA (21): | 0.039147 | |
| Parabolic SAR (0,02-0,02-0,2): | 0.028937 | |
| Elder Ray (13): | 0.007683 | |
| Super Trend (3,10): | 0.028908 | |
| Zig ZAG (10): | 0.046957 | |
| VORTEX (21): | 1.1639 | |
| Stochastique (14,3,5): | 74.40 | |
| TEMA (21): | 0.041159 | |
| Williams %R (14): | -9.66 | |
| Chande Momentum Oscillator (20): | 0.011404 | |
| Repulse (5,40,3): | 19.7047 | |
| ROCnROLL: | 1 | |
| TRIX (15,9): | 1.4798 | |
| Courbe Coppock: | 56.26 |
| MA7: | 0.037644 | |
| MA20: | 0.033491 | |
| MA50: | 0.028013 | |
| MA100: | 0.022595 | |
| MAexp7: | 0.039412 | |
| MAexp20: | 0.034345 | |
| MAexp50: | 0.029111 | |
| MAexp100: | 0.025166 | |
| Price / MA7: | +24.65% | |
| Price / MA20: | +40.10% | |
| Price / MA50: | +67.50% | |
| Price / MA100: | +107.67% | |
| Price / MAexp7: | +19.06% | |
| Price / MAexp20: | +36.62% | |
| Price / MAexp50: | +61.18% | |
| Price / MAexp100: | +86.45% |
About author

Online


Add a comment
Comments
0 comments on the analysis IOTEX - IOTX/USDT - Daily