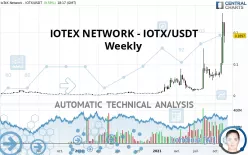
IOTEX - IOTX/USDT - Weekly - Technical analysis published on 11/19/2021 (GMT)
- 333
- 0
- Timeframe : Weekly
- - Analysis generated on
- Status : WITHOUT TARGET

Summary of the analysis

Additional analysis
Quotes
IOTEX NETWORK - IOTX/USDT rating 0.189700 USDT. Over 5 days, this instrument lost -14.28% and was traded between 0.179500 USDT and 0.232900 USDT over the period. The price is currently at +5.68% from its lowest point and -18.55% from its highest point.The Central Gaps scanner detects a bullish opening marking the presence of buyers ahead of sellers at the opening but not sufficiently marked to allow the price to register a quotation gap.
Bullish opening
Type : Bullish
Timeframe : Openning
A study of price movements over other periods shows the following variations:
Technical
Technical analysis of IOTEX NETWORK - IOTX/USDT in Weekly shows a strongly overall bullish trend. The signals given by the moving averages are 92.86% bullish. This strong bullish trend is confirmed by the strong signals currently being given by short-term moving averages. There is no crossing of moving average by the price or crossing of moving averages between themselves.
Technical indicators are strongly bullish, suggesting that the price increase should continue.
Caution: the Central Indicators scanner currently detects an excess:
RSI indicator is overbought : over 80
Type : Neutral
Timeframe : Weekly
CCI indicator is overbought : over 100
Type : Neutral
Timeframe : Weekly
Williams %R indicator is overbought : over -20
Type : Neutral
Timeframe : Weekly
Price is back over the pivot point
Type : Bullish
Timeframe : Weekly
The analysis of the price chart with Central Patterns scanners does not return any result.
For a small rebound in the very short term, the Central Candlesticks scanner currently notes the presence of this bullish pattern in Japanese candlesticks:
Long white line
Type : Bullish
Timeframe : Weekly
| S3 | S2 | S1 | Price | |
|---|---|---|---|---|
| ProTrendLines | 0.049550 | 0.079090 | 0.111600 | 0.189700 |
| Change (%) | -73.88% | -58.31% | -41.17% | - |
| Change | -0.140150 | -0.110610 | -0.078100 | - |
| Level | Minor | Intermediate | Major | - |
Pivot points can also be used to set your price objectives. Here is the price situation in relation to pivot points:
| Pivot points | S3 | S2 | S1 | PP | R1 | R2 | R3 |
|---|---|---|---|---|---|---|---|
| Standard | 0.124133 | 0.145967 | 0.159533 | 0.181367 | 0.194933 | 0.216767 | 0.230333 |
| Camarilla | 0.163365 | 0.166610 | 0.169855 | 0.173100 | 0.176345 | 0.179590 | 0.182835 |
| Woodie | 0.120000 | 0.143900 | 0.155400 | 0.179300 | 0.190800 | 0.214700 | 0.226200 |
| Fibonacci | 0.145967 | 0.159490 | 0.167844 | 0.181367 | 0.194890 | 0.203244 | 0.216767 |
| Pivot points | S3 | S2 | S1 | PP | R1 | R2 | R3 |
|---|---|---|---|---|---|---|---|
| Standard | -0.023150 | 0.037420 | 0.140860 | 0.201430 | 0.304870 | 0.365440 | 0.468880 |
| Camarilla | 0.199197 | 0.214232 | 0.229266 | 0.244300 | 0.259334 | 0.274369 | 0.289403 |
| Woodie | -0.001715 | 0.048138 | 0.162295 | 0.212148 | 0.326305 | 0.376158 | 0.490315 |
| Fibonacci | 0.037420 | 0.100072 | 0.138778 | 0.201430 | 0.264082 | 0.302788 | 0.365440 |
| Pivot points | S3 | S2 | S1 | PP | R1 | R2 | R3 |
|---|---|---|---|---|---|---|---|
| Standard | 0.030320 | 0.043680 | 0.057830 | 0.071190 | 0.085340 | 0.098700 | 0.112850 |
| Camarilla | 0.064415 | 0.066937 | 0.069458 | 0.071980 | 0.074502 | 0.077024 | 0.079545 |
| Woodie | 0.030715 | 0.043878 | 0.058225 | 0.071388 | 0.085735 | 0.098898 | 0.113245 |
| Fibonacci | 0.043680 | 0.054189 | 0.060681 | 0.071190 | 0.081699 | 0.088191 | 0.098700 |
Numerical data
The following are the details of the technical indicators and moving averages that were collected to generate this technical analysis:
| RSI (14): | 70.69 | |
| MACD (12,26,9): | 0.0317 | |
| Directional Movement: | 37.645435 | |
| AROON (14): | 92.857140 | |
| DEMA (21): | 0.125343 | |
| Parabolic SAR (0,02-0,02-0,2): | 0.060986 | |
| Elder Ray (13): | 0.100404 | |
| Super Trend (3,10): | 0.069077 | |
| Zig ZAG (10): | 0.190900 | |
| VORTEX (21): | 1.2094 | |
| Stochastique (14,3,5): | 70.66 | |
| TEMA (21): | 0.147159 | |
| Williams %R (14): | -34.21 | |
| Chande Momentum Oscillator (20): | 0.108340 | |
| Repulse (5,40,3): | 27.8425 | |
| ROCnROLL: | 1 | |
| TRIX (15,9): | 5.6757 | |
| Courbe Coppock: | 507.36 |
| MA7: | 0.206929 | |
| MA20: | 0.154280 | |
| MA50: | 0.102015 | |
| MA100: | 0.086710 | |
| MAexp7: | 0.136749 | |
| MAexp20: | 0.089768 | |
| MAexp50: | 0.056948 | |
| MAexp100: | 0.038512 | |
| Price / MA7: | -8.33% | |
| Price / MA20: | +22.96% | |
| Price / MA50: | +85.95% | |
| Price / MA100: | +118.78% | |
| Price / MAexp7: | +38.72% | |
| Price / MAexp20: | +111.32% | |
| Price / MAexp50: | +233.11% | |
| Price / MAexp100: | +392.57% |
About author

Online


Add a comment
Comments
0 comments on the analysis IOTEX - IOTX/USDT - Weekly