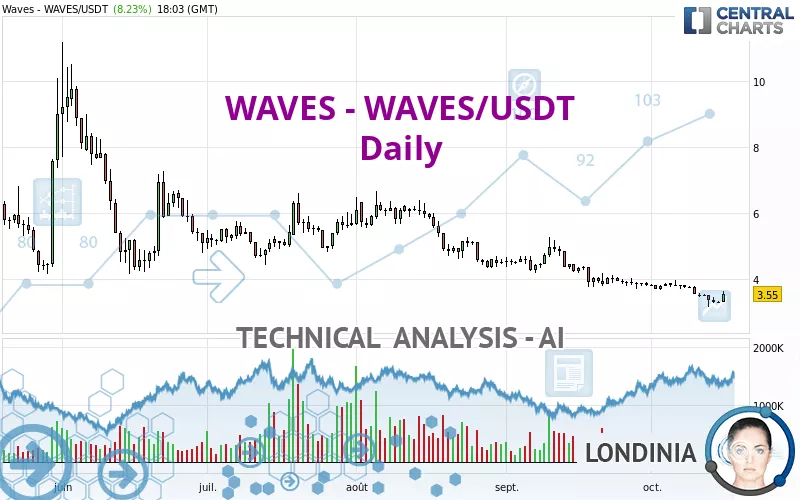
WAVES - WAVES/USDT - Daily - Technical analysis published on 10/16/2022 (GMT)
- 193
- 0
Click here for a new analysis!
- Timeframe : Daily
- - Analysis generated on
- Status : TARGET REACHED
Summary of the analysis

Additional analysis
Quotes
The WAVES - WAVES/USDT rating is 3.55 USDT. The price registered an increase of +8.23% on the session with the lowest point at 3.28 USDT and the highest point at 3.64 USDT. The deviation from the price is +8.23% for the low point and -2.47% for the high point.A bearish opening was detected by the Central Gaps scanner. Sellers are trying to impose a bearish trend in the very short term.
Bearish opening
Type : Bearish
Timeframe : Openning
A study of price movements over other periods shows the following variations:
Near a new LOW record (1 year)
Type : Bearish
Timeframe : Weekly
Near a new LOW record (1 month)
Type : Bearish
Timeframe : Weekly
Technical
Technical analysis of this Daily chart of WAVES - WAVES/USDT indicates that the overall trend is strongly bearish. 92.86% of the signals given by moving averages are bearish. This strongly bearish trend is supported by the strong bearish signals given by short-term moving averages. There is no crossing of moving average by the price or crossing of moving averages between themselves.
The technical indicators are generally neutral. They do not provide relevant information on the direction of future price movements.
Caution: the Central Indicators scanner currently detects an excess:
Previous candle closed under Bollinger bands
Type : Neutral
Timeframe : Daily
CCI indicator: bullish divergence
Type : Bullish
Timeframe : Daily
MACD indicator: bullish divergence
Type : Bullish
Timeframe : Daily
Pivot points : price is over resistance 3
Type : Neutral
Timeframe : Daily
Pivot points : price is under support 3
Type : Neutral
Timeframe : Weekly
Price is back over the pivot point
Type : Bullish
Timeframe : Weekly
Price is back under the pivot point
Type : Bearish
Timeframe : Daily
Williams %R indicator is back over -50
Type : Bullish
Timeframe : Daily
No signals are given by Central Patterns, a market scanner specialised in chart patterns, resistances and supports.
Central Candlesticks, the scanner specialised in Japanese candlesticks, detects a bullish signal that could support the hypothesis of a small rebound in the very short term:
Bullish engulfing lines
Type : Bullish
Timeframe : Daily
| Price | R1 | R2 | R3 | |
|---|---|---|---|---|
| ProTrendLines | 3.55 | 4.42 | 15.46 | 22.30 |
| Change (%) | - | +24.51% | +335.49% | +528.17% |
| Change | - | +0.87 | +11.91 | +18.75 |
| Level | - | Intermediate | Minor | Intermediate |
Pivot points can also be used to set your price objectives. Here is the price situation in relation to pivot points:
| Pivot points | S3 | S2 | S1 | PP | R1 | R2 | R3 |
|---|---|---|---|---|---|---|---|
| Standard | 3.19 | 3.23 | 3.25 | 3.29 | 3.31 | 3.35 | 3.37 |
| Camarilla | 3.26 | 3.27 | 3.28 | 3.28 | 3.29 | 3.29 | 3.30 |
| Woodie | 3.19 | 3.23 | 3.25 | 3.29 | 3.31 | 3.35 | 3.37 |
| Fibonacci | 3.23 | 3.25 | 3.26 | 3.29 | 3.31 | 3.32 | 3.35 |
| Pivot points | S3 | S2 | S1 | PP | R1 | R2 | R3 |
|---|---|---|---|---|---|---|---|
| Standard | 2.37 | 2.75 | 3.02 | 3.40 | 3.67 | 4.05 | 4.32 |
| Camarilla | 3.10 | 3.16 | 3.22 | 3.28 | 3.34 | 3.40 | 3.46 |
| Woodie | 2.31 | 2.72 | 2.96 | 3.37 | 3.61 | 4.02 | 4.26 |
| Fibonacci | 2.75 | 3.00 | 3.16 | 3.40 | 3.65 | 3.81 | 4.05 |
| Pivot points | S3 | S2 | S1 | PP | R1 | R2 | R3 |
|---|---|---|---|---|---|---|---|
| Standard | 1.68 | 2.69 | 3.25 | 4.26 | 4.82 | 5.83 | 6.39 |
| Camarilla | 3.39 | 3.53 | 3.68 | 3.82 | 3.96 | 4.11 | 4.25 |
| Woodie | 1.47 | 2.58 | 3.04 | 4.15 | 4.61 | 5.72 | 6.18 |
| Fibonacci | 2.69 | 3.29 | 3.66 | 4.26 | 4.86 | 5.23 | 5.83 |
Numerical data
The following are the details of the technical indicators and moving averages that were collected to generate this technical analysis:
| RSI (14): | 40.85 | |
| MACD (12,26,9): | -0.2100 | |
| Directional Movement: | -9.85 | |
| AROON (14): | -50.00 | |
| DEMA (21): | 3.38 | |
| Parabolic SAR (0,02-0,02-0,2): | 3.77 | |
| Elder Ray (13): | -0.10 | |
| Super Trend (3,10): | 3.78 | |
| Zig ZAG (10): | 3.56 | |
| VORTEX (21): | 0.8200 | |
| Stochastique (14,3,5): | 29.79 | |
| TEMA (21): | 3.39 | |
| Williams %R (14): | -47.65 | |
| Chande Momentum Oscillator (20): | -0.29 | |
| Repulse (5,40,3): | 6.2800 | |
| ROCnROLL: | -1 | |
| TRIX (15,9): | -0.7100 | |
| Courbe Coppock: | 18.86 |
| MA7: | 3.43 | |
| MA20: | 3.67 | |
| MA50: | 4.08 | |
| MA100: | 4.77 | |
| MAexp7: | 3.47 | |
| MAexp20: | 3.66 | |
| MAexp50: | 4.11 | |
| MAexp100: | 5.25 | |
| Price / MA7: | +3.50% | |
| Price / MA20: | -3.27% | |
| Price / MA50: | -12.99% | |
| Price / MA100: | -25.58% | |
| Price / MAexp7: | +2.31% | |
| Price / MAexp20: | -3.01% | |
| Price / MAexp50: | -13.63% | |
| Price / MAexp100: | -32.38% |
About author

Online


Add a comment
Comments
0 comments on the analysis WAVES - WAVES/USDT - Daily