| Open: | 76.89 |
| Change: | -1.97 |
| Volume: | 1,421,077 |
| Low: | 76.16 |
| High: | 77.10 |
| High / Low range: | 0.94 |
| Type: | Cryptocurrencies |
| Ticker: | ONTUSD |
| ISIN: |
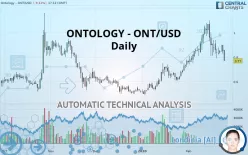
ONTOLOGY - ONT/USD - Daily - Technical analysis published on 02/25/2020 (GMT)
- 320
- 0
- 02/25/2020 - 17:34
- Who voted?
- Timeframe : Daily
- - Analysis generated on 02/25/2020 - 17:34
- Status : NEUTRAL

Summary of the analysis

Additional analysis
Quotes
The ONTOLOGY - ONT/USD rating is 0.770000 USD. On the day, this instrument lost -9.41% with the lowest point at 0.770000 USD and the highest point at 0.860000 USD. The deviation from the price is 0% for the low point and -10.47% for the high point.A bullish opening was detected by the Central Gaps scanner. Buyers are trying to impose a bullish momentum in the very short term.
Bullish opening
Type : Bullish
Timeframe : Openning
So that you have an overall view of the price change, here is a table showing the variations over several periods:
Technical
Technical analysis of this Daily chart of ONTOLOGY - ONT/USD indicates that the overall trend is slightly bullish. Only 50% of the signals given by moving averages are bullish. This slightly bullish trend could turn neutral or reverse given the slightly bearish signals currently being given by short-term moving averages. The Central Indicators market scanner is currently detecting a bearish signal that could impact this trend:
Bearish price crossover with adaptative moving average 50
Type : Bearish
Timeframe : Daily
In fact, according to the parameters integrated into the Central Analyzer system, 10 technical indicators out of 18 analysed are currently bearish. Caution: the Central Indicators scanner currently detects an excess:
Williams %R indicator is oversold : under -80
Type : Neutral
Timeframe : Daily
Pivot points : price is under support 3
Type : Neutral
Timeframe : Daily
RSI indicator is back under 50
Type : Bearish
Timeframe : Daily
Ichimoku - Bearish crossover : Tenkan & Kijun
Type : Bearish
Timeframe : Daily
Price is back under the pivot point
Type : Bearish
Timeframe : Weekly
Central Patterns, the market scanner focusing on chart patterns, resistances and supports found these results:
Horizontal support is broken
Type : Bearish
Timeframe : Daily
Support of channel is broken
Type : Bearish
Timeframe : Daily
No result was found by the Central Candlesticks scanner on Japanese candlesticks.
| S3 | S2 | S1 | Price | R1 | R2 | R3 | |
|---|---|---|---|---|---|---|---|
| ProTrendLines | 0.500000 | 0.590000 | 0.720000 | 0.770000 | 0.830000 | 0.930000 | 0.980000 |
| Change (%) | -35.06% | -23.38% | -6.49% | - | +7.79% | +20.78% | +27.27% |
| Change | -0.270000 | -0.180000 | -0.050000 | - | +0.060000 | +0.160000 | +0.210000 |
| Level | Minor | Intermediate | Minor | - | Major | Minor | Intermediate |
Attention could also be paid to pivot points to set price objectives:
| Pivot points | S3 | S2 | S1 | PP | R1 | R2 | R3 |
|---|---|---|---|---|---|---|---|
| Standard | 0.750000 | 0.790000 | 0.820000 | 0.860000 | 0.890000 | 0.930000 | 0.960000 |
| Camarilla | 0.830750 | 0.837167 | 0.843583 | 0.850000 | 0.856417 | 0.862833 | 0.869250 |
| Woodie | 0.745000 | 0.787500 | 0.815000 | 0.857500 | 0.885000 | 0.927500 | 0.955000 |
| Fibonacci | 0.790000 | 0.816740 | 0.833260 | 0.860000 | 0.886740 | 0.903260 | 0.930000 |
| Pivot points | S3 | S2 | S1 | PP | R1 | R2 | R3 |
|---|---|---|---|---|---|---|---|
| Standard | 0.543333 | 0.666667 | 0.753333 | 0.876667 | 0.963333 | 1.086667 | 1.173333 |
| Camarilla | 0.782250 | 0.801500 | 0.820750 | 0.840000 | 0.859250 | 0.878500 | 0.897750 |
| Woodie | 0.525000 | 0.657500 | 0.735000 | 0.867500 | 0.945000 | 1.077500 | 1.155000 |
| Fibonacci | 0.666667 | 0.746887 | 0.796447 | 0.876667 | 0.956887 | 1.006447 | 1.086667 |
| Pivot points | S3 | S2 | S1 | PP | R1 | R2 | R3 |
|---|---|---|---|---|---|---|---|
| Standard | 0.290000 | 0.390000 | 0.580000 | 0.680000 | 0.870000 | 0.970000 | 1.160000 |
| Camarilla | 0.690250 | 0.716833 | 0.743417 | 0.770000 | 0.796583 | 0.823167 | 0.849750 |
| Woodie | 0.335000 | 0.412500 | 0.625000 | 0.702500 | 0.915000 | 0.992500 | 1.205000 |
| Fibonacci | 0.390000 | 0.500780 | 0.569220 | 0.680000 | 0.790780 | 0.859220 | 0.970000 |
Numerical data
The following is the status of the technical indicators and moving averages at the time of publication of this technical analysis:
| RSI (14): | 41.56 | |
| MACD (12,26,9): | 0.0141 | |
| Directional Movement: | -2.773285 | |
| AROON (14): | -71.428572 | |
| DEMA (21): | 0.894626 | |
| Parabolic SAR (0,02-0,02-0,2): | 0.992978 | |
| Elder Ray (13): | -0.049067 | |
| Super Trend (3,10): | 1.057844 | |
| Zig ZAG (10): | 0.770000 | |
| VORTEX (21): | 1.0055 | |
| Stochastique (14,3,5): | 18.28 | |
| TEMA (21): | 0.858446 | |
| Williams %R (14): | -100.00 | |
| Chande Momentum Oscillator (20): | -0.250000 | |
| Repulse (5,40,3): | -18.0446 | |
| ROCnROLL: | 2 | |
| TRIX (15,9): | 0.7695 | |
| Courbe Coppock: | 19.32 |
| MA7: | 0.841429 | |
| MA20: | 0.906000 | |
| MA50: | 0.768000 | |
| MA100: | 0.677600 | |
| MAexp7: | 0.845042 | |
| MAexp20: | 0.860819 | |
| MAexp50: | 0.793913 | |
| MAexp100: | 0.749801 | |
| Price / MA7: | -8.49% | |
| Price / MA20: | -15.01% | |
| Price / MA50: | +0.26% | |
| Price / MA100: | +13.64% | |
| Price / MAexp7: | -8.88% | |
| Price / MAexp20: | -10.55% | |
| Price / MAexp50: | -3.01% | |
| Price / MAexp100: | +2.69% |
About author

Online


Add a comment
Comments
0 comments on the analysis ONTOLOGY - ONT/USD - Daily