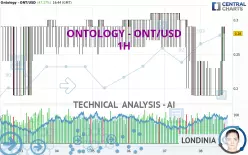
ONTOLOGY - ONT/USD - 1H - Technical analysis published on 01/08/2025 (GMT)
- 106
- 0
Click here for a new analysis!
- Timeframe : 1H
- - Analysis generated on
- Status : INVALID

Summary of the analysis

Additional analysis
Quotes
The ONTOLOGY - ONT/USD rating is 0.280000 USD. The price registered an increase of +47.37% on the session with the lowest point at 0.190000 USD and the highest point at 0.290000 USD. The deviation from the price is +47.37% for the low point and -3.45% for the high point.A bullish opening was detected by the Central Gaps scanner. Buyers are trying to impose a bullish momentum in the very short term.
Bullish opening
Type : Bullish
Timeframe : Openning
So that you have an overall view of the price change, here is a table showing the variations over several periods:
New LOW record (1st january)
Type : Bearish
Timeframe : Weekly
Technical
Technical analysis of this 1H chart of ONTOLOGY - ONT/USD indicates that the overall trend is bullish. The signals returned by the moving averages are 64.29% bullish. This bullish trend is reinforced by the strong signals currently being given by short-term moving averages. The Central Indicators market scanner is currently detecting several bullish signals that could impact this trend:
Bullish trend reversal : Moving Average 20
Type : Bullish
Timeframe : 1 hour
Bullish trend reversal : adaptative moving average 50
Type : Bullish
Timeframe : 1 hour
Bullish trend reversal : adaptative moving average 100
Type : Bullish
Timeframe : 1 hour
In fact, according to the parameters integrated into the Central Analyzer system, 14 technical indicators out of 18 analysed are currently bullish. Caution: the Central Indicators scanner currently detects an excess:
RSI indicator is overbought : over 70
Type : Neutral
Timeframe : 1 hour
CCI indicator is overbought : over 100
Type : Neutral
Timeframe : 1 hour
Previous candle closed over Bollinger bands
Type : Neutral
Timeframe : 1 hour
Williams %R indicator is overbought : over -20
Type : Neutral
Timeframe : 1 hour
Pivot points : price is over resistance 1
Type : Neutral
Timeframe : 1 hour
An analysis of the price chart with the Central Patterns scanner (detector of chart patterns and resistances and supports) shows a result that can have an impact on the price change:
Horizontal resistance is broken
Type : Bullish
Timeframe : 1 hour
There is also a Japanese candlestick pattern detected by Central Candlesticks that could mark the end of the current short-term trend:
Doji
Type : Neutral
Timeframe : 1 hour
| S3 | S2 | S1 | Price | R1 | R2 | R3 | |
|---|---|---|---|---|---|---|---|
| ProTrendLines | 0.200000 | 0.230000 | 0.260000 | 0.280000 | 0.290000 | 0.310000 | 0.350000 |
| Change (%) | -28.57% | -17.86% | -7.14% | - | +3.57% | +10.71% | +25.00% |
| Change | -0.080000 | -0.050000 | -0.020000 | - | +0.010000 | +0.030000 | +0.070000 |
| Level | Major | Intermediate | Intermediate | - | Major | Major | Minor |
Pivot points can also be used to set your price objectives. Here is the price situation in relation to pivot points:
| Pivot points | S3 | S2 | S1 | PP | R1 | R2 | R3 |
|---|---|---|---|---|---|---|---|
| Standard | 0.030000 | 0.110000 | 0.150000 | 0.230000 | 0.270000 | 0.350000 | 0.390000 |
| Camarilla | 0.157000 | 0.168000 | 0.179000 | 0.190000 | 0.201000 | 0.212000 | 0.223000 |
| Woodie | 0.010000 | 0.100000 | 0.130000 | 0.220000 | 0.250000 | 0.340000 | 0.370000 |
| Fibonacci | 0.110000 | 0.155840 | 0.184160 | 0.230000 | 0.275840 | 0.304160 | 0.350000 |
| Pivot points | S3 | S2 | S1 | PP | R1 | R2 | R3 |
|---|---|---|---|---|---|---|---|
| Standard | 0.093333 | 0.136667 | 0.213333 | 0.256667 | 0.333333 | 0.376667 | 0.453333 |
| Camarilla | 0.257000 | 0.268000 | 0.279000 | 0.290000 | 0.301000 | 0.312000 | 0.323000 |
| Woodie | 0.110000 | 0.145000 | 0.230000 | 0.265000 | 0.350000 | 0.385000 | 0.470000 |
| Fibonacci | 0.136667 | 0.182507 | 0.210827 | 0.256667 | 0.302507 | 0.330827 | 0.376667 |
| Pivot points | S3 | S2 | S1 | PP | R1 | R2 | R3 |
|---|---|---|---|---|---|---|---|
| Standard | -0.120000 | 0.030000 | 0.110000 | 0.260000 | 0.340000 | 0.490000 | 0.570000 |
| Camarilla | 0.126750 | 0.147833 | 0.168917 | 0.190000 | 0.211083 | 0.232167 | 0.253250 |
| Woodie | -0.155000 | 0.012500 | 0.075000 | 0.242500 | 0.305000 | 0.472500 | 0.535000 |
| Fibonacci | 0.030000 | 0.117860 | 0.172140 | 0.260000 | 0.347860 | 0.402140 | 0.490000 |
Numerical data
The following is the status of technical indicators and moving averages registered at the time this technical analysis was created:
| RSI (14): | 54.91 | |
| MACD (12,26,9): | -0.0012 | |
| Directional Movement: | 11.640883 | |
| AROON (14): | 85.714286 | |
| DEMA (21): | 0.214907 | |
| Parabolic SAR (0,02-0,02-0,2): | 0.190000 | |
| Elder Ray (13): | 0.039596 | |
| Super Trend (3,10): | 0.304386 | |
| Zig ZAG (10): | 0.290000 | |
| VORTEX (21): | 1.0481 | |
| Stochastique (14,3,5): | 80.00 | |
| TEMA (21): | 0.228797 | |
| Williams %R (14): | -10.00 | |
| Chande Momentum Oscillator (20): | 0.090000 | |
| Repulse (5,40,3): | 24.5332 | |
| ROCnROLL: | 1 | |
| TRIX (15,9): | -1.1199 | |
| Courbe Coppock: | 42.14 |
| MA7: | 0.265714 | |
| MA20: | 0.241500 | |
| MA50: | 0.270200 | |
| MA100: | 0.228100 | |
| MAexp7: | 0.240967 | |
| MAexp20: | 0.224197 | |
| MAexp50: | 0.245123 | |
| MAexp100: | 0.261113 | |
| Price / MA7: | +5.38% | |
| Price / MA20: | +15.94% | |
| Price / MA50: | +3.63% | |
| Price / MA100: | +22.75% | |
| Price / MAexp7: | +16.20% | |
| Price / MAexp20: | +24.89% | |
| Price / MAexp50: | +14.23% | |
| Price / MAexp100: | +7.23% |
About author
Online


Add a comment
Comments
0 comments on the analysis ONTOLOGY - ONT/USD - 1H