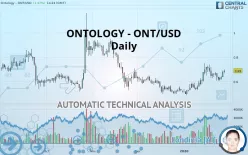
ONTOLOGY - ONT/USD - Daily - Technical analysis published on 01/28/2020 (GMT)
- 303
- 0
- Who voted?
Click here for a new analysis!
- Timeframe : Daily
- - Analysis generated on
- Status : TARGET REACHED

Summary of the analysis

Additional analysis
Quotes
The ONTOLOGY - ONT/USD rating is 0.690000 USD. The price registered an increase of +1.47% on the session and was traded between 0.670000 USD and 0.700000 USD over the period. The price is currently at +2.99% from its lowest and -1.43% from its highest.Here is a more detailed summary of the historical variations registered by ONTOLOGY - ONT/USD:
Technical
Technical analysis of this Daily chart of ONTOLOGY - ONT/USD indicates that the overall trend is bullish. The signals returned by the moving averages are 78.57% bullish. This bullish trend is reinforced by the strong signals currently being given by short-term moving averages. An assessment of moving averages reveals several bullish signals that could impact this trend:
Bullish trend reversal : adaptative moving average 100
Type : Bullish
Timeframe : Daily
Bullish price crossover with Moving Average 100
Type : Bullish
Timeframe : Daily
Bullish price crossover with adaptative moving average 20
Type : Bullish
Timeframe : Daily
An assessment of technical indicators shows a moderate bullish signal.
Caution: the Central Indicators scanner currently detects an excess:
Williams %R indicator is overbought : over -20
Type : Neutral
Timeframe : Daily
Price is back over the pivot point
Type : Bullish
Timeframe : Daily
Price is back under the pivot point
Type : Bearish
Timeframe : Weekly
Williams %R indicator is back over -50
Type : Bullish
Timeframe : Daily
The Central Patterns scanner, which studies chart patterns, resistances and supports, has identified these signals:
Near horizontal resistance
Type : Bearish
Timeframe : Daily
Near resistance of channel
Type : Bearish
Timeframe : Daily
Near support of triangle
Type : Bullish
Timeframe : Daily
The Central Candlesticks scanner which studies Japanese candlesticks did not detect anything.
| S2 | S1 | Price | R1 | R2 | R3 | |
|---|---|---|---|---|---|---|
| ProTrendLines | 0.500000 | 0.590000 | 0.690000 | 0.720000 | 0.830000 | 0.980000 |
| Change (%) | -27.54% | -14.49% | - | +4.35% | +20.29% | +42.03% |
| Change | -0.190000 | -0.100000 | - | +0.030000 | +0.140000 | +0.290000 |
| Level | Minor | Intermediate | - | Minor | Intermediate | Intermediate |
Attention could also be paid to pivot points to set price objectives:
| Pivot points | S3 | S2 | S1 | PP | R1 | R2 | R3 |
|---|---|---|---|---|---|---|---|
| Standard | 0.600000 | 0.620000 | 0.650000 | 0.670000 | 0.700000 | 0.720000 | 0.750000 |
| Camarilla | 0.666250 | 0.670833 | 0.675417 | 0.680000 | 0.684583 | 0.689167 | 0.693750 |
| Woodie | 0.605000 | 0.622500 | 0.655000 | 0.672500 | 0.705000 | 0.722500 | 0.755000 |
| Fibonacci | 0.620000 | 0.639100 | 0.650900 | 0.670000 | 0.689100 | 0.700900 | 0.720000 |
| Pivot points | S3 | S2 | S1 | PP | R1 | R2 | R3 |
|---|---|---|---|---|---|---|---|
| Standard | 0.476667 | 0.543333 | 0.586667 | 0.653333 | 0.696667 | 0.763333 | 0.806667 |
| Camarilla | 0.599750 | 0.609833 | 0.619917 | 0.630000 | 0.640083 | 0.650167 | 0.660250 |
| Woodie | 0.465000 | 0.537500 | 0.575000 | 0.647500 | 0.685000 | 0.757500 | 0.795000 |
| Fibonacci | 0.543333 | 0.585353 | 0.611313 | 0.653333 | 0.695353 | 0.721313 | 0.763333 |
| Pivot points | S3 | S2 | S1 | PP | R1 | R2 | R3 |
|---|---|---|---|---|---|---|---|
| Standard | 0.313333 | 0.406667 | 0.463333 | 0.556667 | 0.613333 | 0.706667 | 0.763333 |
| Camarilla | 0.478750 | 0.492500 | 0.506250 | 0.520000 | 0.533750 | 0.547500 | 0.561250 |
| Woodie | 0.295000 | 0.397500 | 0.445000 | 0.547500 | 0.595000 | 0.697500 | 0.745000 |
| Fibonacci | 0.406667 | 0.463967 | 0.499367 | 0.556667 | 0.613967 | 0.649367 | 0.706667 |
Numerical data
The following is the status of the technical indicators and moving averages at the time of publication of this technical analysis:
| RSI (14): | 61.90 | |
| MACD (12,26,9): | 0.0217 | |
| Directional Movement: | 14.823678 | |
| AROON (14): | 7.142857 | |
| DEMA (21): | 0.670349 | |
| Parabolic SAR (0,02-0,02-0,2): | 0.736549 | |
| Elder Ray (13): | 0.031777 | |
| Super Trend (3,10): | 0.562595 | |
| Zig ZAG (10): | 0.690000 | |
| VORTEX (21): | 1.1165 | |
| Stochastique (14,3,5): | 48.59 | |
| TEMA (21): | 0.683688 | |
| Williams %R (14): | -42.86 | |
| Chande Momentum Oscillator (20): | -0.030000 | |
| Repulse (5,40,3): | 7.1666 | |
| ROCnROLL: | 1 | |
| TRIX (15,9): | 0.6142 | |
| Courbe Coppock: | 10.09 |
| MA7: | 0.652857 | |
| MA20: | 0.647500 | |
| MA50: | 0.587600 | |
| MA100: | 0.663100 | |
| MAexp7: | 0.661885 | |
| MAexp20: | 0.641380 | |
| MAexp50: | 0.623975 | |
| MAexp100: | 0.660042 | |
| Price / MA7: | +5.69% | |
| Price / MA20: | +6.56% | |
| Price / MA50: | +17.43% | |
| Price / MA100: | +4.06% | |
| Price / MAexp7: | +4.25% | |
| Price / MAexp20: | +7.58% | |
| Price / MAexp50: | +10.58% | |
| Price / MAexp100: | +4.54% |
About author

Online


Add a comment
Comments
0 comments on the analysis ONTOLOGY - ONT/USD - Daily