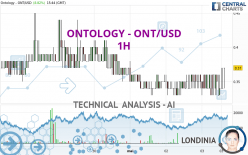
ONTOLOGY - ONT/USD - 1H - Technical analysis published on 05/03/2024 (GMT)
- 84
- 0
- Timeframe : 1H
- - Analysis generated on
- Status : NEUTRAL

Summary of the analysis

Additional analysis
Quotes
ONTOLOGY - ONT/USD rating 0.370000 USD. The price registered an increase of +8.82% on the session with the lowest point at 0.330000 USD and the highest point at 0.370000 USD. The deviation from the price is +12.12% for the low point and 0% for the high point.The Central Gaps scanner detects a bullish opening. A small advantage for buyers in the very short term.
Bullish opening
Type : Bullish
Timeframe : Openning
A study of price movements over other periods shows the following variations:
Abnormal volumes
Timeframe : 20 days
Abnormal volumes
Timeframe : 50 days
Technical
Technical analysis of this 1H chart of ONTOLOGY - ONT/USD indicates that the overall trend is not clearly defined. This indecision could turn into a bullish trend due to the bullish signals currently being given by short-term moving averages. The Central Indicators market scanner is currently detecting several bearish and bullish signals that could impact this trend:
Moving Average bearish crossovers : MA20 & MA50
Type : Bearish
Timeframe : 1 hour
Bullish price crossover with Moving Average 20
Type : Bullish
Timeframe : 1 hour
Bullish price crossover with Moving Average 50
Type : Bullish
Timeframe : 1 hour
Bullish price crossover with Moving Average 100
Type : Bullish
Timeframe : 1 hour
The technical indicators are generally neutral. They do not provide relevant information on the direction of future price movements.
But beware of excesses. The Central Indicators scanner currently detects this:
CCI indicator is overbought : over 100
Type : Neutral
Timeframe : 1 hour
RSI indicator is back over 50
Type : Bullish
Timeframe : 1 hour
MACD crosses UP its Moving Average
Type : Bullish
Timeframe : 1 hour
Ichimoku : price is over the cloud
Type : Bullish
Timeframe : 1 hour
SuperTrend indicator bullish reversal
Type : Bullish
Timeframe : 1 hour
MACD indicator is back over 0
Type : Bullish
Timeframe : 1 hour
Price is back under the pivot point
Type : Bearish
Timeframe : 1 hour
Central Patterns, the market scanner focusing on chart patterns, resistances and supports found this result:
Near resistance of channel
Type : Bearish
Timeframe : 1 hour
The Central Candlesticks scanner, specialised in Japanese candlesticks, did not identify any signals.
| S3 | S2 | S1 | Price | R1 | R2 | R3 | |
|---|---|---|---|---|---|---|---|
| ProTrendLines | 0.307500 | 0.330000 | 0.340000 | 0.370000 | 0.380000 | 0.390000 | 0.410000 |
| Change (%) | -16.89% | -10.81% | -8.11% | - | +2.70% | +5.41% | +10.81% |
| Change | -0.062500 | -0.040000 | -0.030000 | - | +0.010000 | +0.020000 | +0.040000 |
| Level | Intermediate | Intermediate | Minor | - | Major | Intermediate | Minor |
Attention could also be paid to pivot points to set price objectives:
| Pivot points | S3 | S2 | S1 | PP | R1 | R2 | R3 |
|---|---|---|---|---|---|---|---|
| Standard | 0.296667 | 0.313333 | 0.326667 | 0.343333 | 0.356667 | 0.373333 | 0.386667 |
| Camarilla | 0.331750 | 0.334500 | 0.337250 | 0.340000 | 0.342750 | 0.345500 | 0.348250 |
| Woodie | 0.295000 | 0.312500 | 0.325000 | 0.342500 | 0.355000 | 0.372500 | 0.385000 |
| Fibonacci | 0.313333 | 0.324793 | 0.331873 | 0.343333 | 0.354793 | 0.361873 | 0.373333 |
| Pivot points | S3 | S2 | S1 | PP | R1 | R2 | R3 |
|---|---|---|---|---|---|---|---|
| Standard | 0.053333 | 0.186667 | 0.273333 | 0.406667 | 0.493333 | 0.626667 | 0.713333 |
| Camarilla | 0.299500 | 0.319667 | 0.339833 | 0.360000 | 0.380167 | 0.400333 | 0.420500 |
| Woodie | 0.030000 | 0.175000 | 0.250000 | 0.395000 | 0.470000 | 0.615000 | 0.690000 |
| Fibonacci | 0.186667 | 0.270707 | 0.322627 | 0.406667 | 0.490707 | 0.542627 | 0.626667 |
| Pivot points | S3 | S2 | S1 | PP | R1 | R2 | R3 |
|---|---|---|---|---|---|---|---|
| Standard | -0.056667 | 0.096667 | 0.233333 | 0.386667 | 0.523333 | 0.676667 | 0.813333 |
| Camarilla | 0.290250 | 0.316833 | 0.343417 | 0.370000 | 0.396583 | 0.423167 | 0.449750 |
| Woodie | -0.065000 | 0.092500 | 0.225000 | 0.382500 | 0.515000 | 0.672500 | 0.805000 |
| Fibonacci | 0.096667 | 0.207447 | 0.275887 | 0.386667 | 0.497447 | 0.565887 | 0.676667 |
Numerical data
The following is the status of technical indicators and moving averages registered at the time this technical analysis was created:
| RSI (14): | 58.55 | |
| MACD (12,26,9): | -0.0016 | |
| Directional Movement: | 0.831775 | |
| AROON (14): | 50.000000 | |
| DEMA (21): | 0.347730 | |
| Parabolic SAR (0,02-0,02-0,2): | 0.330800 | |
| Elder Ray (13): | 0.007400 | |
| Super Trend (3,10): | 0.277148 | |
| Zig ZAG (10): | 0.370000 | |
| VORTEX (21): | 0.9804 | |
| Stochastique (14,3,5): | 25.00 | |
| TEMA (21): | 0.341821 | |
| Williams %R (14): | -75.00 | |
| Chande Momentum Oscillator (20): | 0.010000 | |
| Repulse (5,40,3): | -1.5628 | |
| ROCnROLL: | 2 | |
| TRIX (15,9): | -0.0009 | |
| Courbe Coppock: | 1.42 |
| MA7: | 0.360000 | |
| MA20: | 0.369000 | |
| MA50: | 0.352000 | |
| MA100: | 0.313700 | |
| MAexp7: | 0.349189 | |
| MAexp20: | 0.344198 | |
| MAexp50: | 0.347567 | |
| MAexp100: | 0.356892 | |
| Price / MA7: | +2.78% | |
| Price / MA20: | +0.27% | |
| Price / MA50: | +5.11% | |
| Price / MA100: | +17.95% | |
| Price / MAexp7: | +5.96% | |
| Price / MAexp20: | +7.50% | |
| Price / MAexp50: | +6.45% | |
| Price / MAexp100: | +3.67% |
About author
Online


Add a comment
Comments
0 comments on the analysis ONTOLOGY - ONT/USD - 1H