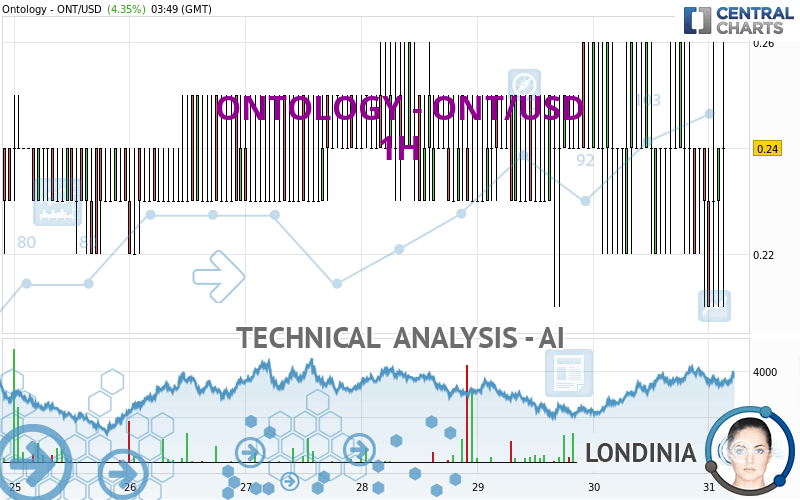
ONTOLOGY - ONT/USD - 1H - Technical analysis published on 01/31/2024 (GMT)
- 103
- 0
Click here for a new analysis!
- Timeframe : 1H
- - Analysis generated on
- Status : TARGET REACHED

Summary of the analysis

Additional analysis
Quotes
ONTOLOGY - ONT/USD rating 0.240000 USD. On the day, this instrument gained +4.35% and was between 0.210000 USD and 0.260000 USD. This implies that the price is at +14.29% from its lowest and at -7.69% from its highest.So that you have an overall view of the price change, here is a table showing the variations over several periods:
Abnormal volumes
Timeframe : 20 days
Abnormal volumes
Timeframe : 50 days
Technical
Technical analysis of this 1H chart of ONTOLOGY - ONT/USD indicates that the overall trend is bullish. The signals given by moving averages are 71.43% bullish. This bullish trend is slowing down slightly given the slightly bullish signals of short-term moving averages. The Central Indicators scanner detects bullish and bearish signals on moving averages that could impact this trend:
Bullish trend reversal : adaptative moving average 20
Type : Bullish
Timeframe : 1 hour
Bullish trend reversal : adaptative moving average 50
Type : Bullish
Timeframe : 1 hour
Bearish price crossover with Moving Average 20
Type : Bearish
Timeframe : 1 hour
Bearish price crossover with adaptative moving average 20
Type : Bearish
Timeframe : 1 hour
Bearish price crossover with adaptative moving average 100
Type : Bearish
Timeframe : 1 hour
The technical indicators are generally neutral. They do not provide relevant information on the direction of future price movements.
Central Indicators, the scanner specialised in technical indicators, has identified these signals:
RSI indicator is back under 50
Type : Bearish
Timeframe : 1 hour
MACD crosses UP its Moving Average
Type : Bullish
Timeframe : 1 hour
Ichimoku : price is over the cloud
Type : Bullish
Timeframe : 1 hour
Williams %R indicator is back under -50
Type : Bearish
Timeframe : 1 hour
Central Patterns, the market scanner focusing on chart patterns, resistances and supports found this result:
Horizontal support is broken
Type : Bearish
Timeframe : 1 hour
The Central Candlesticks scanner currently notes the presence of this pattern in Japanese candlesticks that could mark the end of the short-term trend currently underway:
Doji
Type : Neutral
Timeframe : 1 hour
| S3 | S2 | S1 | Price | R1 | R2 | |
|---|---|---|---|---|---|---|
| ProTrendLines | 0.200000 | 0.220000 | 0.230000 | 0.240000 | 0.250000 | 0.260000 |
| Change (%) | -16.67% | -8.33% | -4.17% | - | +4.17% | +8.33% |
| Change | -0.040000 | -0.020000 | -0.010000 | - | +0.010000 | +0.020000 |
| Level | Minor | Intermediate | Major | - | Intermediate | Minor |
Attention could also be paid to pivot points to set price objectives:
| Pivot points | S3 | S2 | S1 | PP | R1 | R2 | R3 |
|---|---|---|---|---|---|---|---|
| Standard | 0.156667 | 0.183333 | 0.206667 | 0.233333 | 0.256667 | 0.283333 | 0.306667 |
| Camarilla | 0.216250 | 0.220833 | 0.225417 | 0.230000 | 0.234583 | 0.239167 | 0.243750 |
| Woodie | 0.155000 | 0.182500 | 0.205000 | 0.232500 | 0.255000 | 0.282500 | 0.305000 |
| Fibonacci | 0.183333 | 0.202433 | 0.214233 | 0.233333 | 0.252433 | 0.264233 | 0.283333 |
| Pivot points | S3 | S2 | S1 | PP | R1 | R2 | R3 |
|---|---|---|---|---|---|---|---|
| Standard | 0.143333 | 0.166667 | 0.203333 | 0.226667 | 0.263333 | 0.286667 | 0.323333 |
| Camarilla | 0.223500 | 0.229000 | 0.234500 | 0.240000 | 0.245500 | 0.251000 | 0.256500 |
| Woodie | 0.150000 | 0.170000 | 0.210000 | 0.230000 | 0.270000 | 0.290000 | 0.330000 |
| Fibonacci | 0.166667 | 0.189587 | 0.203747 | 0.226667 | 0.249587 | 0.263747 | 0.286667 |
| Pivot points | S3 | S2 | S1 | PP | R1 | R2 | R3 |
|---|---|---|---|---|---|---|---|
| Standard | 0.053333 | 0.126667 | 0.233333 | 0.306667 | 0.413333 | 0.486667 | 0.593333 |
| Camarilla | 0.290500 | 0.307000 | 0.323500 | 0.340000 | 0.356500 | 0.373000 | 0.389500 |
| Woodie | 0.070000 | 0.135000 | 0.250000 | 0.315000 | 0.430000 | 0.495000 | 0.610000 |
| Fibonacci | 0.126667 | 0.195427 | 0.237907 | 0.306667 | 0.375427 | 0.417907 | 0.486667 |
Numerical data
The following are the details of the technical indicators and moving averages that were collected to generate this technical analysis:
| RSI (14): | 50.92 | |
| MACD (12,26,9): | -0.0012 | |
| Directional Movement: | 2.437683 | |
| AROON (14): | -50.000000 | |
| DEMA (21): | 0.227971 | |
| Parabolic SAR (0,02-0,02-0,2): | 0.210000 | |
| Elder Ray (13): | 0.000080 | |
| Super Trend (3,10): | 0.196305 | |
| Zig ZAG (10): | 0.210000 | |
| VORTEX (21): | 0.9831 | |
| Stochastique (14,3,5): | 53.33 | |
| TEMA (21): | 0.223255 | |
| Williams %R (14): | -40.00 | |
| Chande Momentum Oscillator (20): | -0.030000 | |
| Repulse (5,40,3): | -24.0041 | |
| ROCnROLL: | 1 | |
| TRIX (15,9): | -0.1746 | |
| Courbe Coppock: | 9.09 |
| MA7: | 0.237143 | |
| MA20: | 0.241000 | |
| MA50: | 0.245400 | |
| MA100: | 0.233800 | |
| MAexp7: | 0.233719 | |
| MAexp20: | 0.238466 | |
| MAexp50: | 0.238777 | |
| MAexp100: | 0.238049 | |
| Price / MA7: | +1.20% | |
| Price / MA20: | -0.41% | |
| Price / MA50: | -2.20% | |
| Price / MA100: | +2.65% | |
| Price / MAexp7: | +2.69% | |
| Price / MAexp20: | +0.64% | |
| Price / MAexp50: | +0.51% | |
| Price / MAexp100: | +0.82% |
About author
Online


Add a comment
Comments
0 comments on the analysis ONTOLOGY - ONT/USD - 1H