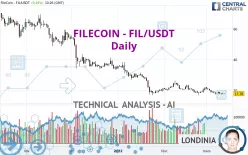
FILECOIN - FIL/USDT - Daily - Technical analysis published on 03/13/2022 (GMT)
- 247
- 0
Click here for a new analysis!
- Timeframe : Daily
- - Analysis generated on
- Status : INVALID

Summary of the analysis

Additional analysis
Quotes
The FILECOIN - FIL/USDT rating is 17.78 USDT. On the day, this instrument gained +0.34% and was traded between 17.66 USDT and 18.06 USDT over the period. The price is currently at +0.68% from its lowest and -1.55% from its highest.The Central Gaps scanner detects a bearish opening. A small advantage for sellers in the very short term.
Bearish opening
Type : Bearish
Timeframe : Openning
Here is a more detailed summary of the historical variations registered by FILECOIN - FIL/USDT:
Near a new LOW record (1 year)
Type : Bearish
Timeframe : Weekly
Near a new LOW record (1st january)
Type : Bearish
Timeframe : Weekly
Near a new LOW record (1 month)
Type : Bearish
Timeframe : Weekly
Technical
Technical analysis of FILECOIN - FIL/USDT in Daily shows a overall strongly bearish trend. 92.86% of the signals given by moving averages are bearish. This strongly bearish trend is supported by the strong bearish signals given by short-term moving averages. The Central Indicators market scanner is currently detecting a bearish signal that could impact this trend:
Moving Average bearish crossovers : AMA20 & AMA50
Type : Bearish
Timeframe : Daily
In fact, Central Analyzer took into account 18 technical indicators and the result was as follows: 4 are bullish, 4 are neutral and 10 are bearish. Caution: the Central Indicators scanner currently detects an excess:
CCI indicator is oversold : under -100
Type : Neutral
Timeframe : Daily
MACD indicator: bullish divergence
Type : Bullish
Timeframe : Daily
Williams %R indicator is oversold : under -80
Type : Neutral
Timeframe : Daily
Pivot points : price is under support 1
Type : Neutral
Timeframe : Weekly
Aroon indicator bearish trend
Type : Bearish
Timeframe : Daily
No signals are given by Central Patterns, a market scanner specialised in chart patterns, resistances and supports.
The Central Candlesticks scanner, specialised in Japanese candlesticks, did not identify any signals.
| S1 | Price | R1 | R2 | R3 | |
|---|---|---|---|---|---|
| ProTrendLines | 4.74 | 17.78 | 19.68 | 41.23 | 55.30 |
| Change (%) | -73.34% | - | +10.69% | +131.89% | +211.02% |
| Change | -13.04 | - | +1.90 | +23.45 | +37.52 |
| Level | Intermediate | - | Intermediate | Minor | Major |
Pivot points can also be used to set your price objectives. Here is the price situation in relation to pivot points:
| Pivot points | S3 | S2 | S1 | PP | R1 | R2 | R3 |
|---|---|---|---|---|---|---|---|
| Standard | 16.16 | 16.76 | 17.24 | 17.84 | 18.32 | 18.92 | 19.40 |
| Camarilla | 17.42 | 17.52 | 17.62 | 17.72 | 17.82 | 17.92 | 18.02 |
| Woodie | 16.10 | 16.73 | 17.18 | 17.81 | 18.26 | 18.89 | 19.34 |
| Fibonacci | 16.76 | 17.17 | 17.43 | 17.84 | 18.25 | 18.51 | 18.92 |
| Pivot points | S3 | S2 | S1 | PP | R1 | R2 | R3 |
|---|---|---|---|---|---|---|---|
| Standard | 14.70 | 15.92 | 16.82 | 18.04 | 18.94 | 20.16 | 21.06 |
| Camarilla | 17.14 | 17.33 | 17.53 | 17.72 | 17.91 | 18.11 | 18.30 |
| Woodie | 14.54 | 15.84 | 16.66 | 17.96 | 18.78 | 20.08 | 20.90 |
| Fibonacci | 15.92 | 16.73 | 17.23 | 18.04 | 18.85 | 19.35 | 20.16 |
| Pivot points | S3 | S2 | S1 | PP | R1 | R2 | R3 |
|---|---|---|---|---|---|---|---|
| Standard | 7.44 | 12.10 | 16.90 | 21.56 | 26.36 | 31.02 | 35.82 |
| Camarilla | 19.10 | 19.97 | 20.83 | 21.70 | 22.57 | 23.43 | 24.30 |
| Woodie | 7.51 | 12.14 | 16.97 | 21.60 | 26.43 | 31.06 | 35.89 |
| Fibonacci | 12.10 | 15.71 | 17.95 | 21.56 | 25.17 | 27.41 | 31.02 |
Numerical data
The following is the status of technical indicators and moving averages registered at the time this technical analysis was created:
| RSI (14): | 40.03 | |
| MACD (12,26,9): | -0.9700 | |
| Directional Movement: | -6.03 | |
| AROON (14): | -42.85 | |
| DEMA (21): | 17.69 | |
| Parabolic SAR (0,02-0,02-0,2): | 21.63 | |
| Elder Ray (13): | -0.64 | |
| Super Trend (3,10): | 21.61 | |
| Zig ZAG (10): | 17.79 | |
| VORTEX (21): | 0.9400 | |
| Stochastique (14,3,5): | 9.73 | |
| TEMA (21): | 17.85 | |
| Williams %R (14): | -86.79 | |
| Chande Momentum Oscillator (20): | -3.15 | |
| Repulse (5,40,3): | -3.0600 | |
| ROCnROLL: | 2 | |
| TRIX (15,9): | -0.5900 | |
| Courbe Coppock: | 16.83 |
| MA7: | 17.93 | |
| MA20: | 18.99 | |
| MA50: | 20.18 | |
| MA100: | 27.13 | |
| MAexp7: | 18.05 | |
| MAexp20: | 18.98 | |
| MAexp50: | 21.78 | |
| MAexp100: | 28.59 | |
| Price / MA7: | -0.84% | |
| Price / MA20: | -6.37% | |
| Price / MA50: | -11.89% | |
| Price / MA100: | -34.46% | |
| Price / MAexp7: | -1.50% | |
| Price / MAexp20: | -6.32% | |
| Price / MAexp50: | -18.37% | |
| Price / MAexp100: | -37.81% |
About author

Online


Add a comment
Comments
0 comments on the analysis FILECOIN - FIL/USDT - Daily