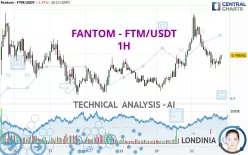
FANTOM - FTM/USDT - 1H - Technical analysis published on 10/21/2024 (GMT)
- 152
- 0
Click here for a new analysis!
- Timeframe : 1H
- - Analysis generated on
- Status : INVALID

Summary of the analysis
Additional analysis
Quotes
The FANTOM - FTM/USDT price is 0.748335 USDT. The price registered a decrease of -1.97% on the session and was between 0.733552 USDT and 0.794418 USDT. This implies that the price is at +2.02% from its lowest and at -5.80% from its highest.A bearish opening was detected by the Central Gaps scanner. Sellers are trying to impose a bearish trend in the very short term.
Bearish opening
Type : Bearish
Timeframe : Openning
So that you have an overall view of the price change, here is a table showing the variations over several periods:
New HIGH record (1st january)
Type : Bullish
Timeframe : Weekly
Near a new HIGH record (1 month)
Type : Bullish
Timeframe : Weekly
Technical
Technical analysis of FANTOM - FTM/USDT in 1H shows an overall bullish trend. 71.43% of the signals given by moving averages are bullish. Caution: the neutral signals currently given by short-term moving averages show us that the global trend is losing momentum. The Central Indicators scanner detects a bullish signal on moving averages that could impact this trend:
Bullish trend reversal : adaptative moving average 50
Type : Bullish
Timeframe : 1 hour
An assessment of technical indicators does not currently provide any relevant information to suggest whether the signal given by the technical indicators is more bullish or bearish.
Central Indicators, the detector scanner for these technical indicators has recently detected several signals:
Parabolic SAR indicator bullish reversal
Type : Bullish
Timeframe : 1 hour
Price is back over the pivot point
Type : Bullish
Timeframe : Weekly
Central Patterns, the scanner specializing in chart patterns, did not identify any signals.
The Central Candlesticks scanner currently notes the presence of this pattern in Japanese candlesticks that could mark the end of the short-term trend currently underway:
Doji
Type : Neutral
Timeframe : 1 hour
| S3 | S2 | S1 | Price | R1 | R2 | R3 | |
|---|---|---|---|---|---|---|---|
| ProTrendLines | 0.683440 | 0.705685 | 0.745736 | 0.748335 | 0.762311 | 0.795825 | 0.836747 |
| Change (%) | -8.67% | -5.70% | -0.35% | - | +1.87% | +6.35% | +11.81% |
| Change | -0.064895 | -0.042650 | -0.002599 | - | +0.013976 | +0.047490 | +0.088412 |
| Level | Minor | Major | Major | - | Intermediate | Minor | Minor |
Attention could also be paid to pivot points to set price objectives:
| Pivot points | S3 | S2 | S1 | PP | R1 | R2 | R3 |
|---|---|---|---|---|---|---|---|
| Standard | 0.671140 | 0.689582 | 0.726468 | 0.744910 | 0.781796 | 0.800238 | 0.837124 |
| Camarilla | 0.748138 | 0.753210 | 0.758281 | 0.763353 | 0.768425 | 0.773497 | 0.778568 |
| Woodie | 0.680361 | 0.694193 | 0.735689 | 0.749521 | 0.791017 | 0.804849 | 0.846345 |
| Fibonacci | 0.689582 | 0.710718 | 0.723775 | 0.744910 | 0.766046 | 0.779103 | 0.800238 |
| Pivot points | S3 | S2 | S1 | PP | R1 | R2 | R3 |
|---|---|---|---|---|---|---|---|
| Standard | 0.504312 | 0.577843 | 0.648762 | 0.722293 | 0.793212 | 0.866743 | 0.937662 |
| Camarilla | 0.679956 | 0.693198 | 0.706439 | 0.719680 | 0.732921 | 0.746163 | 0.759404 |
| Woodie | 0.503005 | 0.577190 | 0.647455 | 0.721640 | 0.791905 | 0.866090 | 0.936355 |
| Fibonacci | 0.577843 | 0.633023 | 0.667113 | 0.722293 | 0.777473 | 0.811563 | 0.866743 |
| Pivot points | S3 | S2 | S1 | PP | R1 | R2 | R3 |
|---|---|---|---|---|---|---|---|
| Standard | 0.077830 | 0.217508 | 0.455485 | 0.595163 | 0.833140 | 0.972818 | 1.210795 |
| Camarilla | 0.589608 | 0.624226 | 0.658845 | 0.693463 | 0.728081 | 0.762700 | 0.797318 |
| Woodie | 0.126981 | 0.242083 | 0.504636 | 0.619738 | 0.882291 | 0.997393 | 1.259946 |
| Fibonacci | 0.217508 | 0.361772 | 0.450899 | 0.595163 | 0.739427 | 0.828554 | 0.972818 |
Numerical data
The following is the status of technical indicators and moving averages registered at the time this technical analysis was created:
| RSI (14): | 42.38 | |
| MACD (12,26,9): | -0.0021 | |
| Directional Movement: | -7.665835 | |
| AROON (14): | -78.571429 | |
| DEMA (21): | 0.747462 | |
| Parabolic SAR (0,02-0,02-0,2): | 0.749260 | |
| Elder Ray (13): | -0.007285 | |
| Super Trend (3,10): | 0.764287 | |
| Zig ZAG (10): | 0.740062 | |
| VORTEX (21): | 0.9193 | |
| Stochastique (14,3,5): | 15.08 | |
| TEMA (21): | 0.740744 | |
| Williams %R (14): | -83.26 | |
| Chande Momentum Oscillator (20): | -0.017605 | |
| Repulse (5,40,3): | 0.2105 | |
| ROCnROLL: | 2 | |
| TRIX (15,9): | 0.0320 | |
| Courbe Coppock: | 7.22 |
| MA7: | 0.739874 | |
| MA20: | 0.687293 | |
| MA50: | 0.607873 | |
| MA100: | 0.517304 | |
| MAexp7: | 0.742723 | |
| MAexp20: | 0.747934 | |
| MAexp50: | 0.743933 | |
| MAexp100: | 0.737389 | |
| Price / MA7: | +1.14% | |
| Price / MA20: | +8.88% | |
| Price / MA50: | +23.11% | |
| Price / MA100: | +44.66% | |
| Price / MAexp7: | +0.76% | |
| Price / MAexp20: | +0.05% | |
| Price / MAexp50: | +0.59% | |
| Price / MAexp100: | +1.48% |
About author

Online


Add a comment
Comments
0 comments on the analysis FANTOM - FTM/USDT - 1H