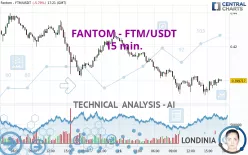
FANTOM - FTM/USDT - 15 min. - Technical analysis published on 02/21/2024 (GMT)
- 170
- 0
Click here for a new analysis!
- Timeframe : 15 min.
- - Analysis generated on
- Status : INVALID

Summary of the analysis
Additional analysis
Quotes
The FANTOM - FTM/USDT rating is 0.399717 USDT. The price registered a decrease of -5.79% on the session and was traded between 0.390946 USDT and 0.424937 USDT over the period. The price is currently at +2.24% from its lowest and -5.93% from its highest.So that you have an overall view of the price change, here is a table showing the variations over several periods:
Near a new HIGH record (1 month)
Type : Bullish
Timeframe : Weekly
Technical
A technical analysis in 15 min. of this FANTOM - FTM/USDT chart shows a bearish trend. 71.43% of the signals given by moving averages are bearish. Caution: the neutral signals currently given by short-term moving averages show us that the global trend is losing momentum. The Central Indicators market scanner is currently detecting a bearish signal that could impact this trend:
Bearish price crossover with adaptative moving average 50
Type : Bearish
Timeframe : 15 minutes
In fact, 11 technical indicators on 18 studied are currently bullish. Caution: the Central Indicators scanner currently detects an excess:
Williams %R indicator is overbought : over -20
Type : Neutral
Timeframe : 15 minutes
Pivot points : price is under support 1
Type : Neutral
Timeframe : 15 minutes
RSI indicator is back over 50
Type : Bullish
Timeframe : 15 minutes
Aroon indicator bullish trend
Type : Bullish
Timeframe : 15 minutes
Momentum indicator is back over 0
Type : Bullish
Timeframe : 15 minutes
No signals are given by Central Patterns, a market scanner specialised in chart patterns, resistances and supports.
No result was found by the Central Candlesticks scanner on Japanese candlesticks.
| S3 | S2 | S1 | Price | R1 | R2 | R3 | |
|---|---|---|---|---|---|---|---|
| ProTrendLines | 0.349392 | 0.374050 | 0.386719 | 0.399717 | 0.401892 | 0.417762 | 0.425314 |
| Change (%) | -12.59% | -6.42% | -3.25% | - | +0.54% | +4.51% | +6.40% |
| Change | -0.050325 | -0.025667 | -0.012998 | - | +0.002175 | +0.018045 | +0.025597 |
| Level | Major | Minor | Minor | - | Intermediate | Intermediate | Minor |
Pivot points can also be used to set your price objectives. Here is the price situation in relation to pivot points:
| Pivot points | S3 | S2 | S1 | PP | R1 | R2 | R3 |
|---|---|---|---|---|---|---|---|
| Standard | 0.366493 | 0.384288 | 0.404292 | 0.422087 | 0.442091 | 0.459886 | 0.479890 |
| Camarilla | 0.413902 | 0.417367 | 0.420832 | 0.424297 | 0.427762 | 0.431227 | 0.434692 |
| Woodie | 0.367599 | 0.384840 | 0.405398 | 0.422639 | 0.443197 | 0.460438 | 0.480996 |
| Fibonacci | 0.384288 | 0.398727 | 0.407647 | 0.422087 | 0.436526 | 0.445446 | 0.459886 |
| Pivot points | S3 | S2 | S1 | PP | R1 | R2 | R3 |
|---|---|---|---|---|---|---|---|
| Standard | 0.323584 | 0.348817 | 0.374848 | 0.400081 | 0.426112 | 0.451345 | 0.477376 |
| Camarilla | 0.386781 | 0.391481 | 0.396180 | 0.400879 | 0.405578 | 0.410277 | 0.414977 |
| Woodie | 0.323983 | 0.349017 | 0.375247 | 0.400281 | 0.426511 | 0.451545 | 0.477775 |
| Fibonacci | 0.348817 | 0.368400 | 0.380498 | 0.400081 | 0.419664 | 0.431762 | 0.451345 |
| Pivot points | S3 | S2 | S1 | PP | R1 | R2 | R3 |
|---|---|---|---|---|---|---|---|
| Standard | 0.082347 | 0.194682 | 0.273601 | 0.385936 | 0.464855 | 0.577190 | 0.656109 |
| Camarilla | 0.299924 | 0.317456 | 0.334987 | 0.352519 | 0.370051 | 0.387582 | 0.405114 |
| Woodie | 0.065638 | 0.186328 | 0.256892 | 0.377582 | 0.448146 | 0.568836 | 0.639400 |
| Fibonacci | 0.194682 | 0.267741 | 0.312877 | 0.385936 | 0.458995 | 0.504131 | 0.577190 |
Numerical data
The following is the status of the technical indicators and moving averages at the time of publication of this technical analysis:
| RSI (14): | 52.85 | |
| MACD (12,26,9): | -0.0005 | |
| Directional Movement: | -0.480371 | |
| AROON (14): | 64.285714 | |
| DEMA (21): | 0.397246 | |
| Parabolic SAR (0,02-0,02-0,2): | 0.391897 | |
| Elder Ray (13): | 0.001868 | |
| Super Trend (3,10): | 0.402808 | |
| Zig ZAG (10): | 0.399388 | |
| VORTEX (21): | 1.0605 | |
| Stochastique (14,3,5): | 85.40 | |
| TEMA (21): | 0.398711 | |
| Williams %R (14): | -14.28 | |
| Chande Momentum Oscillator (20): | 0.003854 | |
| Repulse (5,40,3): | 0.5552 | |
| ROCnROLL: | -1 | |
| TRIX (15,9): | -0.0462 | |
| Courbe Coppock: | 0.06 |
| MA7: | 0.414781 | |
| MA20: | 0.390746 | |
| MA50: | 0.385770 | |
| MA100: | 0.386641 | |
| MAexp7: | 0.398968 | |
| MAexp20: | 0.398410 | |
| MAexp50: | 0.401774 | |
| MAexp100: | 0.407670 | |
| Price / MA7: | -3.63% | |
| Price / MA20: | +2.30% | |
| Price / MA50: | +3.62% | |
| Price / MA100: | +3.38% | |
| Price / MAexp7: | +0.19% | |
| Price / MAexp20: | +0.33% | |
| Price / MAexp50: | -0.51% | |
| Price / MAexp100: | -1.95% |
About author

Online


Add a comment
Comments
0 comments on the analysis FANTOM - FTM/USDT - 15 min.