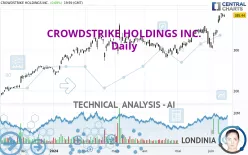
CROWDSTRIKE HOLDINGS INC. - Daily - Technical analysis published on 06/17/2024 (GMT)
- 163
- 0
Click here for a new analysis!
- Timeframe : Daily
- - Analysis generated on
- Status : LEVEL MAINTAINED

Summary of the analysis

Additional analysis
Quotes
The CROWDSTRIKE HOLDINGS INC. price is 385.43 USD. On the day, this instrument gained +0.68% and was traded between 381.15 USD and 388.35 USD over the period. The price is currently at +1.12% from its lowest and -0.75% from its highest.The Central Gaps scanner detects a bearish opening marking the presence of sellers ahead of buyers at the opening but not sufficiently marked to allow the price to register a quotation gap.
Bearish opening
Type : Bearish
Timeframe : Openning
Here is a more detailed summary of the historical variations registered by CROWDSTRIKE HOLDINGS INC.:
New HIGH record (5 years)
Type : Bullish
Timeframe : Weekly
Near a new HIGH record (1 year)
Type : Bullish
Timeframe : Weekly
Near a new HIGH record (1st january)
Type : Bullish
Timeframe : Weekly
Near a new HIGH record (1 month)
Type : Bullish
Timeframe : Weekly
The Central Volumes scanner notes the presence of abnormal volumes:
Abnormal volumes
Timeframe : 5 days
Technical
Technical analysis of CROWDSTRIKE HOLDINGS INC. in Daily shows a strongly overall bullish trend. 92.86% of the signals given by moving averages are bullish. The overall trend is supported by the strong bullish signals from short-term moving averages. The Central Indicators market scanner currently does not detect any result that concerns moving averages.
An assessment of technical indicators shows a strong bullish signal.
Caution: the Central Indicators scanner currently detects an excess:
CCI indicator is overbought : over 100
Type : Neutral
Timeframe : Daily
Williams %R indicator is overbought : over -20
Type : Neutral
Timeframe : Daily
Pivot points : price is over resistance 2
Type : Neutral
Timeframe : Weekly
Price is back over the pivot point
Type : Bullish
Timeframe : Daily
An analysis of the price chart with the Central Patterns scanner (detector of chart patterns and resistances and supports) shows a result that can have an impact on the price change:
Near resistance of channel
Type : Bearish
Timeframe : Daily
No result was found by the Central Candlesticks scanner on Japanese candlesticks.
| S3 | S2 | S1 | Price | |
|---|---|---|---|---|
| ProTrendLines | 283.39 | 334.07 | 351.47 | 385.43 |
| Change (%) | -26.47% | -13.33% | -8.81% | - |
| Change | -102.04 | -51.36 | -33.96 | - |
| Level | Major | Major | Intermediate | - |
Attention could also be paid to pivot points to set price objectives:
| Pivot points | S3 | S2 | S1 | PP | R1 | R2 | R3 |
|---|---|---|---|---|---|---|---|
| Standard | 374.40 | 377.78 | 381.60 | 384.98 | 388.80 | 392.18 | 396.00 |
| Camarilla | 383.45 | 384.11 | 384.77 | 385.43 | 386.09 | 386.75 | 387.41 |
| Woodie | 374.63 | 377.89 | 381.83 | 385.09 | 389.03 | 392.29 | 396.23 |
| Fibonacci | 377.78 | 380.53 | 382.23 | 384.98 | 387.73 | 389.43 | 392.18 |
| Pivot points | S3 | S2 | S1 | PP | R1 | R2 | R3 |
|---|---|---|---|---|---|---|---|
| Standard | 272.04 | 287.77 | 318.45 | 334.18 | 364.86 | 380.59 | 411.27 |
| Camarilla | 336.36 | 340.61 | 344.87 | 349.12 | 353.37 | 357.63 | 361.88 |
| Woodie | 279.51 | 291.51 | 325.92 | 337.92 | 372.33 | 384.33 | 418.74 |
| Fibonacci | 287.77 | 305.50 | 316.46 | 334.18 | 351.91 | 362.87 | 380.59 |
| Pivot points | S3 | S2 | S1 | PP | R1 | R2 | R3 |
|---|---|---|---|---|---|---|---|
| Standard | 211.58 | 250.06 | 281.87 | 320.35 | 352.16 | 390.64 | 422.45 |
| Camarilla | 294.34 | 300.78 | 307.23 | 313.67 | 320.11 | 326.56 | 333.00 |
| Woodie | 208.24 | 248.39 | 278.53 | 318.68 | 348.82 | 388.97 | 419.11 |
| Fibonacci | 250.06 | 276.91 | 293.50 | 320.35 | 347.20 | 363.79 | 390.64 |
Numerical data
The following is the status of the technical indicators and moving averages at the time of publication of this technical analysis:
| RSI (14): | 68.88 | |
| MACD (12,26,9): | 15.5000 | |
| Directional Movement: | 21.81 | |
| AROON (14): | 42.85 | |
| DEMA (21): | 369.64 | |
| Parabolic SAR (0,02-0,02-0,2): | 330.92 | |
| Elder Ray (13): | 24.63 | |
| Super Trend (3,10): | 339.51 | |
| Zig ZAG (10): | 385.43 | |
| VORTEX (21): | 1.0600 | |
| Stochastique (14,3,5): | 93.69 | |
| TEMA (21): | 379.00 | |
| Williams %R (14): | -6.06 | |
| Chande Momentum Oscillator (20): | 35.91 | |
| Repulse (5,40,3): | 1.5600 | |
| ROCnROLL: | 1 | |
| TRIX (15,9): | 0.4500 | |
| Courbe Coppock: | 16.04 |
| MA7: | 372.06 | |
| MA20: | 348.50 | |
| MA50: | 324.53 | |
| MA100: | 320.70 | |
| MAexp7: | 372.24 | |
| MAexp20: | 351.47 | |
| MAexp50: | 333.28 | |
| MAexp100: | 312.85 | |
| Price / MA7: | +3.59% | |
| Price / MA20: | +10.60% | |
| Price / MA50: | +18.77% | |
| Price / MA100: | +20.18% | |
| Price / MAexp7: | +3.54% | |
| Price / MAexp20: | +9.66% | |
| Price / MAexp50: | +15.65% | |
| Price / MAexp100: | +23.20% |
News
Don't forget to follow the news on CROWDSTRIKE HOLDINGS INC.. At the time of publication of this analysis, the latest news was as follows:
- CrowdStrike Reports Fiscal First Quarter 2021 Financial Results
- CrowdStrike to Participate in Upcoming Investor Conferences
- CrowdStrike to Host Investor Product Briefing at RSA
- CrowdStrike Announces Date of Fourth Quarter and Fiscal Year 2020 Financial Results Conference Call
About author

Online


Add a comment
Comments
0 comments on the analysis CROWDSTRIKE HOLDINGS INC. - Daily