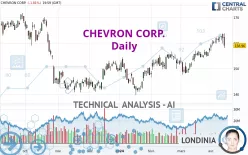
CHEVRON CORP. - Daily - Technical analysis published on 04/13/2024 (GMT)
- 170
- 0
Click here for a new analysis!
- Timeframe : Daily
- - Analysis generated on
- Status : TARGET REACHED

Summary of the analysis

Additional analysis
Quotes
The CHEVRON CORP. price is 158.96 USD. The price registered a decrease of -1.81% on the session and was between 158.04 USD and 163.87 USD. This implies that the price is at +0.58% from its lowest and at -3.00% from its highest.Here is a more detailed summary of the historical variations registered by CHEVRON CORP.:
Near a new HIGH record (1 year)
Type : Bullish
Timeframe : Weekly
New HIGH record (1st january)
Type : Bullish
Timeframe : Weekly
New HIGH record (1 month)
Type : Bullish
Timeframe : Weekly
Technical
Technical analysis of CHEVRON CORP. in Daily shows a strongly overall bullish trend. 92.86% of the signals given by moving averages are bullish. The overall trend is supported by the strong bullish signals from short-term moving averages. The Central Indicators market scanner is currently detecting a bearish signal that could impact this trend:
Bearish price crossover with adaptative moving average 20
Type : Bearish
Timeframe : Daily
In fact, Central Analyzer took into account 18 technical indicators and the result was as follows: 7 are bullish, 6 are neutral and 5 are bearish. Central Indicators, the detector scanner for these technical indicators has recently detected several signals:
Pivot points : price is under support 1
Type : Neutral
Timeframe : Daily
Price is back under the pivot point
Type : Bearish
Timeframe : Weekly
Williams %R indicator is back under -50
Type : Bearish
Timeframe : Daily
Central Patterns, the scanner specializing in chart patterns, did not identify any signals.
No result was found by the Central Candlesticks scanner on Japanese candlesticks.
| S3 | S2 | S1 | Price | R1 | R2 | R3 | |
|---|---|---|---|---|---|---|---|
| ProTrendLines | 138.96 | 148.31 | 156.62 | 158.96 | 161.72 | 167.45 | 180.50 |
| Change (%) | -12.58% | -6.70% | -1.47% | - | +1.74% | +5.34% | +13.55% |
| Change | -20.00 | -10.65 | -2.34 | - | +2.76 | +8.49 | +21.54 |
| Level | Major | Major | Major | - | Major | Major | Major |
To determine price objectives, it is also possible to use the pivot points. Here is the price position in relation to pivot points:
| Pivot points | S3 | S2 | S1 | PP | R1 | R2 | R3 |
|---|---|---|---|---|---|---|---|
| Standard | 150.88 | 154.46 | 156.71 | 160.29 | 162.54 | 166.12 | 168.37 |
| Camarilla | 157.36 | 157.89 | 158.43 | 158.96 | 159.49 | 160.03 | 160.56 |
| Woodie | 150.22 | 154.13 | 156.05 | 159.96 | 161.88 | 165.79 | 167.71 |
| Fibonacci | 154.46 | 156.69 | 158.06 | 160.29 | 162.52 | 163.89 | 166.12 |
| Pivot points | S3 | S2 | S1 | PP | R1 | R2 | R3 |
|---|---|---|---|---|---|---|---|
| Standard | 140.36 | 144.01 | 150.88 | 154.53 | 161.40 | 165.05 | 171.92 |
| Camarilla | 154.85 | 155.81 | 156.78 | 157.74 | 158.70 | 159.67 | 160.63 |
| Woodie | 141.96 | 144.82 | 152.48 | 155.34 | 163.00 | 165.86 | 173.52 |
| Fibonacci | 144.01 | 148.03 | 150.52 | 154.53 | 158.55 | 161.04 | 165.05 |
Numerical data
The following is the status of technical indicators and moving averages registered at the time this technical analysis was created:
| RSI (14): | 55.39 | |
| MACD (12,26,9): | 2.3000 | |
| Directional Movement: | 6.88 | |
| AROON (14): | 100.00 | |
| DEMA (21): | 161.54 | |
| Parabolic SAR (0,02-0,02-0,2): | 159.80 | |
| Elder Ray (13): | 1.23 | |
| Super Trend (3,10): | 155.59 | |
| Zig ZAG (10): | 158.96 | |
| VORTEX (21): | 1.0800 | |
| Stochastique (14,3,5): | 75.77 | |
| TEMA (21): | 162.19 | |
| Williams %R (14): | -53.25 | |
| Chande Momentum Oscillator (20): | 3.69 | |
| Repulse (5,40,3): | -2.8900 | |
| ROCnROLL: | -1 | |
| TRIX (15,9): | 0.2100 | |
| Courbe Coppock: | 7.51 |
| MA7: | 161.30 | |
| MA20: | 158.29 | |
| MA50: | 154.34 | |
| MA100: | 149.67 | |
| MAexp7: | 160.67 | |
| MAexp20: | 158.52 | |
| MAexp50: | 154.94 | |
| MAexp100: | 152.81 | |
| Price / MA7: | -1.45% | |
| Price / MA20: | +0.42% | |
| Price / MA50: | +2.99% | |
| Price / MA100: | +6.21% | |
| Price / MAexp7: | -1.06% | |
| Price / MAexp20: | +0.28% | |
| Price / MAexp50: | +2.59% | |
| Price / MAexp100: | +4.02% |
News
The last news published on CHEVRON CORP. at the time of the generation of this analysis was as follows:
- Thinking about trading options or stock in Catalent, Amazon, Chevron, Block Inc, or Boeing?
- Thinking about buying stock in Conservative Broadcast Media & Journalism, Chevron, Compugen, Digital World Acquisition, or Rumble?
- Thinking about trading options or stock in ZIM Integrated Shipping, Chevron, Alphabet Inc, Spotify, or UiPath?
- Chevron Announces $16 billion 2024 Capex Budget
- Thinking about buying stock in Tesla Inc, Chevron, Theseus Pharmaceuticals, Cybin Inc, or NXU Inc.?
About author

Online


Add a comment
Comments
0 comments on the analysis CHEVRON CORP. - Daily