REAVES UTILITY INCOME FUND - 1H - Technical analysis published on 11/25/2024 (GMT)
- 107
- 0
Click here for a new analysis!
- Timeframe : 1H
- - Analysis generated on
- Status : LEVEL MAINTAINED
Summary of the analysis

Additional analysis
Quotes
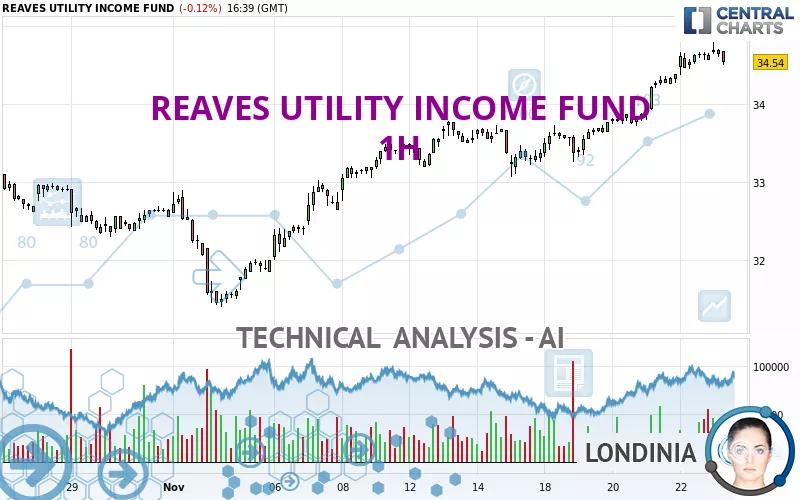
The REAVES UTILITY INCOME FUND price is 34.54 USD. The price registered a decrease of -0.12% on the session and was between 34.50 USD and 34.71 USD. This implies that the price is at +0.12% from its lowest and at -0.49% from its highest.The Central Gaps scanner detects the formation of a bullish gap marking the strong presence of buyers against sellers at the opening. This formed a quotation gap.
Opening Gap UP
Type : Bullish
Timeframe : Openning
Here is a more detailed summary of the historical variations registered by REAVES UTILITY INCOME FUND:
Near a new HIGH record (5 years)
Type : Bullish
Timeframe : Weekly
New HIGH record (1 year)
Type : Bullish
Timeframe : Weekly
New HIGH record (1st january)
Type : Bullish
Timeframe : Weekly
New HIGH record (1 month)
Type : Bullish
Timeframe : Weekly
Technical
Technical analysis of this 1H chart of REAVES UTILITY INCOME FUND indicates that the overall trend is strongly bullish. 92.86% of the signals given by moving averages are bullish. The overall trend is supported by the strong bullish signals from short-term moving averages. There is no crossing of moving average by the price or crossing of moving averages between themselves.
The probability of a further increase are moderate given the direction of the technical indicators.
Central Indicators, the scanner specialised in technical indicators, has identified these signals:
MACD crosses DOWN its Moving Average
Type : Bearish
Timeframe : 1 hour
Parabolic SAR indicator bearish reversal
Type : Bearish
Timeframe : 1 hour
Price is back under the pivot point
Type : Bearish
Timeframe : 1 hour
The Central Patterns scanner, which studies chart patterns, resistances and supports, has identified this signal:
Near resistance of triangle
Type : Bearish
Timeframe : 1 hour
No result was found by the Central Candlesticks scanner on Japanese candlesticks.
| S3 | S2 | S1 | Price | R1 | R2 | |
|---|---|---|---|---|---|---|
| ProTrendLines | 32.42 | 32.91 | 33.72 | 34.54 | 34.67 | 35.72 |
| Change (%) | -6.14% | -4.72% | -2.37% | - | +0.38% | +3.42% |
| Change | -2.12 | -1.63 | -0.82 | - | +0.13 | +1.18 |
| Level | Major | Minor | Intermediate | - | Intermediate | Minor |
Pivot points can also be used to set your price objectives. Here is the price situation in relation to pivot points:
| Pivot points | S3 | S2 | S1 | PP | R1 | R2 | R3 |
|---|---|---|---|---|---|---|---|
| Standard | 34.13 | 34.25 | 34.42 | 34.54 | 34.71 | 34.83 | 35.00 |
| Camarilla | 34.50 | 34.53 | 34.55 | 34.58 | 34.61 | 34.63 | 34.66 |
| Woodie | 34.15 | 34.26 | 34.44 | 34.55 | 34.73 | 34.84 | 35.02 |
| Fibonacci | 34.25 | 34.36 | 34.43 | 34.54 | 34.65 | 34.72 | 34.83 |
| Pivot points | S3 | S2 | S1 | PP | R1 | R2 | R3 |
|---|---|---|---|---|---|---|---|
| Standard | 32.26 | 32.76 | 33.67 | 34.17 | 35.08 | 35.58 | 36.49 |
| Camarilla | 34.19 | 34.32 | 34.45 | 34.58 | 34.71 | 34.84 | 34.97 |
| Woodie | 32.47 | 32.86 | 33.88 | 34.27 | 35.29 | 35.68 | 36.70 |
| Fibonacci | 32.76 | 33.30 | 33.63 | 34.17 | 34.71 | 35.04 | 35.58 |
| Pivot points | S3 | S2 | S1 | PP | R1 | R2 | R3 |
|---|---|---|---|---|---|---|---|
| Standard | 29.26 | 30.10 | 31.22 | 32.06 | 33.18 | 34.02 | 35.14 |
| Camarilla | 31.79 | 31.97 | 32.15 | 32.33 | 32.51 | 32.69 | 32.87 |
| Woodie | 29.39 | 30.17 | 31.35 | 32.13 | 33.31 | 34.09 | 35.27 |
| Fibonacci | 30.10 | 30.85 | 31.32 | 32.06 | 32.81 | 33.28 | 34.02 |
Numerical data
The following is the status of technical indicators and moving averages registered at the time this technical analysis was created:
| RSI (14): | 67.97 | |
| MACD (12,26,9): | 0.2400 | |
| Directional Movement: | 20.81 | |
| AROON (14): | 92.86 | |
| DEMA (21): | 34.70 | |
| Parabolic SAR (0,02-0,02-0,2): | 34.60 | |
| Elder Ray (13): | 0.13 | |
| Super Trend (3,10): | 34.29 | |
| Zig ZAG (10): | 34.64 | |
| VORTEX (21): | 1.2800 | |
| Stochastique (14,3,5): | 90.56 | |
| TEMA (21): | 34.76 | |
| Williams %R (14): | -17.34 | |
| Chande Momentum Oscillator (20): | 0.33 | |
| Repulse (5,40,3): | 0.0500 | |
| ROCnROLL: | 1 | |
| TRIX (15,9): | 0.1100 | |
| Courbe Coppock: | 3.12 |
| MA7: | 34.00 | |
| MA20: | 33.05 | |
| MA50: | 32.44 | |
| MA100: | 30.45 | |
| MAexp7: | 34.60 | |
| MAexp20: | 34.39 | |
| MAexp50: | 33.96 | |
| MAexp100: | 33.51 | |
| Price / MA7: | +1.59% | |
| Price / MA20: | +4.51% | |
| Price / MA50: | +6.47% | |
| Price / MA100: | +13.43% | |
| Price / MAexp7: | -0.17% | |
| Price / MAexp20: | +0.44% | |
| Price / MAexp50: | +1.71% | |
| Price / MAexp100: | +3.07% |
News
The latest news and videos published on REAVES UTILITY INCOME FUND at the time of the analysis were as follows:
- Reaves Utility Income Fund Section 19(a) Notice
- Reaves Utility Income Fund Announces Regular Monthly Distributions of $0.19 per Share
- Reaves Utility Income Fund Section 19(a) Notice
- Reaves Utility Income Fund Section 19(a) Notice
- Reaves Utility Income Fund Section 19(a) Notice
About author
Online


Add a comment
Comments
0 comments on the analysis REAVES UTILITY INCOME FUND - 1H