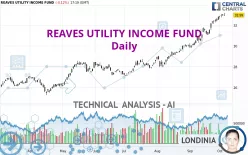
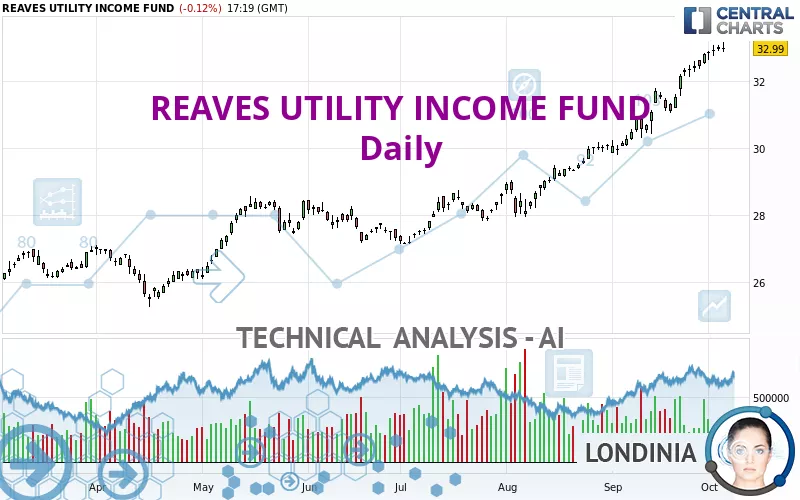
REAVES UTILITY INCOME FUND - Daily - Technical analysis published on 10/04/2024 (GMT)
- 172
- 0
Click here for a new analysis!
- Timeframe : Daily
- - Analysis generated on
- Status : INVALID
Summary of the analysis

Additional analysis
Quotes
The REAVES UTILITY INCOME FUND rating is 32.99 USD. On the day, this instrument lost -0.12% and was between 32.87 USD and 33.17 USD. This implies that the price is at +0.37% from its lowest and at -0.54% from its highest.The Central Gaps scanner detects a bearish opening. A small advantage for sellers in the very short term.
Bearish opening
Type : Bearish
Timeframe : Openning
A study of price movements over other periods shows the following variations:
New HIGH record (1 year)
Type : Bullish
Timeframe : Weekly
New HIGH record (1st january)
Type : Bullish
Timeframe : Weekly
New HIGH record (1 month)
Type : Bullish
Timeframe : Weekly
Technical
Technical analysis of this Daily chart of REAVES UTILITY INCOME FUND indicates that the overall trend is strongly bullish. The signals given by the moving averages are 92.86% bullish. This strong bullish trend is confirmed by the strong signals currently being given by short-term moving averages. There is no crossing of moving average by the price or crossing of moving averages between themselves.
In fact, according to the parameters integrated into the Central Analyzer system, 11 technical indicators out of 18 analysed are currently bullish. But beware of excesses. The Central Indicators scanner currently detects this:
RSI indicator is overbought : over 80
Type : Neutral
Timeframe : Daily
RSI indicator: bearish divergence
Type : Bearish
Timeframe : Daily
Williams %R indicator is overbought : over -20
Type : Neutral
Timeframe : Daily
Pivot points : price is over resistance 1
Type : Neutral
Timeframe : Weekly
Price is back over the pivot point
Type : Bullish
Timeframe : Daily
No signals are given by Central Patterns, a market scanner specialised in chart patterns, resistances and supports.
Central Candlesticks, the scanner specialised in Japanese candlesticks, detects these signals that could have an impact on the current short-term trend:
Bearish harami
Type : Bearish
Timeframe : Daily
Doji
Type : Neutral
Timeframe : Daily
| S3 | S2 | S1 | Price | R1 | |
|---|---|---|---|---|---|
| ProTrendLines | 29.39 | 31.53 | 32.80 | 32.99 | 36.14 |
| Change (%) | -10.91% | -4.43% | -0.58% | - | +9.55% |
| Change | -3.60 | -1.46 | -0.19 | - | +3.15 |
| Level | Intermediate | Major | Major | - | Intermediate |
To determine price objectives, it is also possible to use the pivot points. Here is the price position in relation to pivot points:
| Pivot points | S3 | S2 | S1 | PP | R1 | R2 | R3 |
|---|---|---|---|---|---|---|---|
| Standard | 32.76 | 32.84 | 32.93 | 33.01 | 33.10 | 33.18 | 33.27 |
| Camarilla | 32.98 | 33.00 | 33.01 | 33.03 | 33.05 | 33.06 | 33.08 |
| Woodie | 32.78 | 32.84 | 32.95 | 33.01 | 33.12 | 33.18 | 33.29 |
| Fibonacci | 32.84 | 32.90 | 32.94 | 33.01 | 33.07 | 33.11 | 33.18 |
| Pivot points | S3 | S2 | S1 | PP | R1 | R2 | R3 |
|---|---|---|---|---|---|---|---|
| Standard | 30.72 | 31.14 | 31.80 | 32.22 | 32.88 | 33.30 | 33.96 |
| Camarilla | 32.16 | 32.26 | 32.36 | 32.46 | 32.56 | 32.66 | 32.76 |
| Woodie | 30.84 | 31.20 | 31.92 | 32.28 | 33.00 | 33.36 | 34.08 |
| Fibonacci | 31.14 | 31.55 | 31.81 | 32.22 | 32.63 | 32.89 | 33.30 |
| Pivot points | S3 | S2 | S1 | PP | R1 | R2 | R3 |
|---|---|---|---|---|---|---|---|
| Standard | 27.48 | 28.56 | 30.68 | 31.76 | 33.88 | 34.96 | 37.08 |
| Camarilla | 31.93 | 32.22 | 32.52 | 32.81 | 33.10 | 33.40 | 33.69 |
| Woodie | 28.01 | 28.82 | 31.21 | 32.02 | 34.41 | 35.22 | 37.61 |
| Fibonacci | 28.56 | 29.78 | 30.53 | 31.76 | 32.98 | 33.73 | 34.96 |
Numerical data
The following are the details of the technical indicators and moving averages that were collected to generate this technical analysis:
| RSI (14): | 81.91 | |
| MACD (12,26,9): | 0.8700 | |
| Directional Movement: | 35.62 | |
| AROON (14): | 78.57 | |
| DEMA (21): | 33.02 | |
| Parabolic SAR (0,02-0,02-0,2): | 32.59 | |
| Elder Ray (13): | 0.69 | |
| Super Trend (3,10): | 32.01 | |
| Zig ZAG (10): | 32.96 | |
| VORTEX (21): | 1.3000 | |
| Stochastique (14,3,5): | 94.10 | |
| TEMA (21): | 33.23 | |
| Williams %R (14): | -9.95 | |
| Chande Momentum Oscillator (20): | 1.77 | |
| Repulse (5,40,3): | 0.1800 | |
| ROCnROLL: | 1 | |
| TRIX (15,9): | 0.4000 | |
| Courbe Coppock: | 12.56 |
| MA7: | 32.77 | |
| MA20: | 31.80 | |
| MA50: | 30.07 | |
| MA100: | 28.69 | |
| MAexp7: | 32.74 | |
| MAexp20: | 31.88 | |
| MAexp50: | 30.46 | |
| MAexp100: | 29.06 | |
| Price / MA7: | +0.67% | |
| Price / MA20: | +3.74% | |
| Price / MA50: | +9.71% | |
| Price / MA100: | +14.99% | |
| Price / MAexp7: | +0.76% | |
| Price / MAexp20: | +3.48% | |
| Price / MAexp50: | +8.31% | |
| Price / MAexp100: | +13.52% |
News
Don't forget to follow the news on REAVES UTILITY INCOME FUND. At the time of publication of this analysis, the latest news was as follows:
- Reaves Utility Income Fund Section 19(a) Notice
- Reaves Utility Income Fund Section 19(a) Notice
- Reaves Utility Income Fund Section 19(a) Notice
- Reaves Utility Income Fund Announces Regular Monthly Distributions 0f $0.19 Per Share
- Reaves Utility Income Fund Section 19(a) Notice
About author
Online


Add a comment
Comments
0 comments on the analysis REAVES UTILITY INCOME FUND - Daily