REAVES UTILITY INCOME FUND - Daily - Technical analysis published on 08/16/2024 (GMT)
- 127
- 0
Click here for a new analysis!
- Timeframe : Daily
- - Analysis generated on
- Status : TARGET REACHED
Summary of the analysis

Additional analysis
Quotes
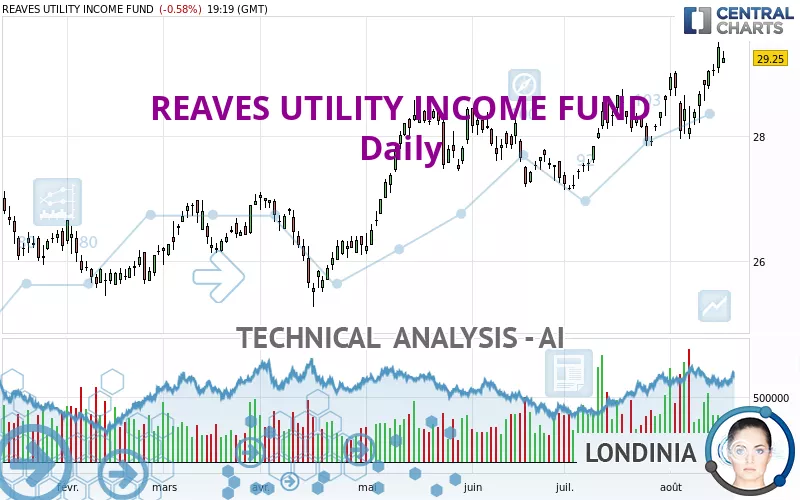
The REAVES UTILITY INCOME FUND rating is 29.25 USD. The price is lower by -0.58% since the last closing with the lowest point at 29.16 USD and the highest point at 29.35 USD. The deviation from the price is +0.31% for the low point and -0.34% for the high point.A bearish opening was detected by the Central Gaps scanner. Sellers are trying to impose a bearish trend in the very short term.
Bearish opening
Type : Bearish
Timeframe : Openning
A study of price movements over other periods shows the following variations:
New HIGH record (1 year)
Type : Bullish
Timeframe : Weekly
New HIGH record (1st january)
Type : Bullish
Timeframe : Weekly
New HIGH record (1 month)
Type : Bullish
Timeframe : Weekly
Technical
Technical analysis of REAVES UTILITY INCOME FUND in Daily shows a strongly overall bullish trend. The signals given by the moving averages are 92.86% bullish. This strong bullish trend is confirmed by the strong signals currently being given by short-term moving averages. There is no crossing of moving average by the price or crossing of moving averages between themselves.
An assessment of technical indicators shows a strong bullish signal.
Caution: the Central Indicators scanner currently detects an excess:
CCI indicator is overbought : over 100
Type : Neutral
Timeframe : Daily
Williams %R indicator is overbought : over -20
Type : Neutral
Timeframe : Daily
Pivot points : price is over resistance 2
Type : Neutral
Timeframe : Weekly
Central Patterns, the market scanner focusing on chart patterns, resistances and supports found these results:
Near horizontal resistance
Type : Bearish
Timeframe : Daily
Resistance of channel is broken
Type : Bullish
Timeframe : Daily
The Central Candlesticks scanner which studies Japanese candlesticks did not detect anything.
| S3 | S2 | S1 | Price | R1 | R2 | R3 | |
|---|---|---|---|---|---|---|---|
| ProTrendLines | 26.17 | 28.12 | 28.75 | 29.25 | 29.57 | 30.50 | 32.99 |
| Change (%) | -10.53% | -3.86% | -1.71% | - | +1.09% | +4.27% | +12.79% |
| Change | -3.08 | -1.13 | -0.50 | - | +0.32 | +1.25 | +3.74 |
| Level | Major | Major | Intermediate | - | Minor | Intermediate | Major |
Attention could also be paid to pivot points to set price objectives:
| Pivot points | S3 | S2 | S1 | PP | R1 | R2 | R3 |
|---|---|---|---|---|---|---|---|
| Standard | 28.44 | 28.63 | 28.93 | 29.12 | 29.42 | 29.61 | 29.91 |
| Camarilla | 29.10 | 29.14 | 29.19 | 29.23 | 29.28 | 29.32 | 29.37 |
| Woodie | 28.50 | 28.66 | 28.99 | 29.15 | 29.48 | 29.64 | 29.97 |
| Fibonacci | 28.63 | 28.82 | 28.93 | 29.12 | 29.31 | 29.42 | 29.61 |
| Pivot points | S3 | S2 | S1 | PP | R1 | R2 | R3 |
|---|---|---|---|---|---|---|---|
| Standard | 27.23 | 27.50 | 27.99 | 28.26 | 28.75 | 29.02 | 29.51 |
| Camarilla | 28.27 | 28.34 | 28.41 | 28.48 | 28.55 | 28.62 | 28.69 |
| Woodie | 27.34 | 27.56 | 28.10 | 28.32 | 28.86 | 29.08 | 29.62 |
| Fibonacci | 27.50 | 27.79 | 27.97 | 28.26 | 28.55 | 28.73 | 29.02 |
| Pivot points | S3 | S2 | S1 | PP | R1 | R2 | R3 |
|---|---|---|---|---|---|---|---|
| Standard | 25.62 | 26.20 | 27.30 | 27.88 | 28.98 | 29.56 | 30.66 |
| Camarilla | 27.94 | 28.09 | 28.25 | 28.40 | 28.55 | 28.71 | 28.86 |
| Woodie | 25.88 | 26.33 | 27.56 | 28.01 | 29.24 | 29.69 | 30.92 |
| Fibonacci | 26.20 | 26.84 | 27.24 | 27.88 | 28.52 | 28.92 | 29.56 |
Numerical data
The following are the details of the technical indicators and moving averages that were collected to generate this technical analysis:
| RSI (14): | 67.73 | |
| MACD (12,26,9): | 0.3600 | |
| Directional Movement: | 23.06 | |
| AROON (14): | 64.29 | |
| DEMA (21): | 28.87 | |
| Parabolic SAR (0,02-0,02-0,2): | 27.93 | |
| Elder Ray (13): | 0.64 | |
| Super Trend (3,10): | 28.20 | |
| Zig ZAG (10): | 29.25 | |
| VORTEX (21): | 1.1000 | |
| Stochastique (14,3,5): | 93.37 | |
| TEMA (21): | 29.01 | |
| Williams %R (14): | -6.27 | |
| Chande Momentum Oscillator (20): | 0.85 | |
| Repulse (5,40,3): | 1.6800 | |
| ROCnROLL: | 1 | |
| TRIX (15,9): | 0.1400 | |
| Courbe Coppock: | 5.21 |
| MA7: | 28.78 | |
| MA20: | 28.35 | |
| MA50: | 27.77 | |
| MA100: | 27.06 | |
| MAexp7: | 28.86 | |
| MAexp20: | 28.43 | |
| MAexp50: | 27.88 | |
| MAexp100: | 27.19 | |
| Price / MA7: | +1.63% | |
| Price / MA20: | +3.17% | |
| Price / MA50: | +5.33% | |
| Price / MA100: | +8.09% | |
| Price / MAexp7: | +1.35% | |
| Price / MAexp20: | +2.88% | |
| Price / MAexp50: | +4.91% | |
| Price / MAexp100: | +7.58% |
News
The last news published on REAVES UTILITY INCOME FUND at the time of the generation of this analysis was as follows:
- Reaves Utility Income Fund Section 19(a) Notice
- Reaves Utility Income Fund Announces Regular Monthly Distributions 0f $0.19 Per Share
- Reaves Utility Income Fund Section 19(a) Notice
- Reaves Utility Income Fund Section 19(a) Notice
- Reaves Utility Income Fund Section 19(a) Notice
About author
Online


Add a comment
Comments
0 comments on the analysis REAVES UTILITY INCOME FUND - Daily