REAVES UTILITY INCOME FUND - 1H - Technical analysis published on 07/29/2024 (GMT)
- 154
- 0
Click here for a new analysis!
- Timeframe : 1H
- - Analysis generated on
- Status : TARGET REACHED
Summary of the analysis

Additional analysis
Quotes
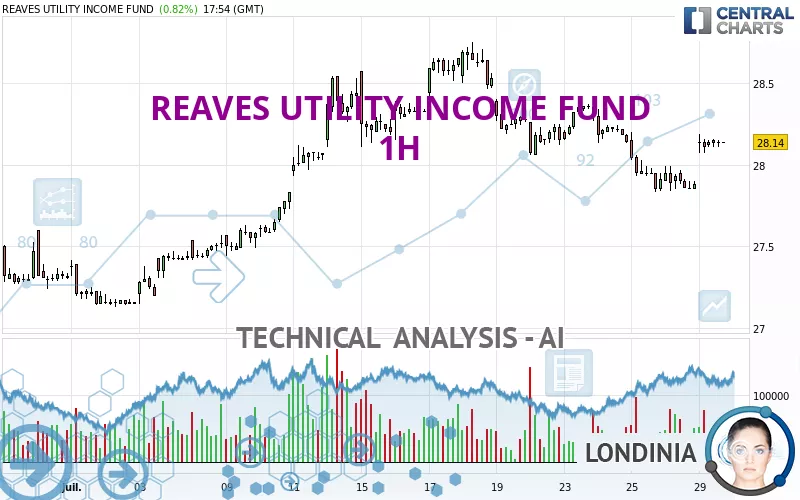
The REAVES UTILITY INCOME FUND price is 28.14 USD. On the day, this instrument gained +0.82% with the lowest point at 28.07 USD and the highest point at 28.19 USD. The deviation from the price is +0.25% for the low point and -0.18% for the high point.The Central Gaps scanner detects the formation of a bullish gap marking the strong presence of buyers against sellers at the opening. This formed a quotation gap.
Opening Gap UP
Type : Bullish
Timeframe : Openning
So that you have an overall view of the price change, here is a table showing the variations over several periods:
Near a new HIGH record (1 year)
Type : Bullish
Timeframe : Weekly
Near a new HIGH record (1st january)
Type : Bullish
Timeframe : Weekly
Near a new LOW record (1 month)
Type : Bearish
Timeframe : Weekly
Technical
A technical analysis in 1H of this REAVES UTILITY INCOME FUND chart shows a bullish trend. 64.29% of the signals given by moving averages are bullish. The overall trend seems to be showing some signs of weakness, as do the tentative bullish signals given by short-term moving averages. The Central Indicators market scanner currently does not detect any result that concerns moving averages.
The probability of a further increase is high given the direction of the technical indicators.
Caution: the Central Indicators scanner currently detects an excess:
Williams %R indicator is overbought : over -20
Type : Neutral
Timeframe : 1 hour
Pivot points : price is over resistance 3
Type : Neutral
Timeframe : 1 hour
The Central Patterns scanner, which studies chart patterns, resistances and supports, has identified these signals:
Near horizontal resistance
Type : Bearish
Timeframe : 1 hour
Resistance of channel is broken
Type : Bullish
Timeframe : 1 hour
The Central Candlesticks scanner which studies Japanese candlesticks did not detect anything.
| S3 | S2 | S1 | Price | R1 | R2 | R3 | |
|---|---|---|---|---|---|---|---|
| ProTrendLines | 27.59 | 27.83 | 28.06 | 28.14 | 28.31 | 28.56 | 29.76 |
| Change (%) | -1.95% | -1.10% | -0.28% | - | +0.60% | +1.49% | +5.76% |
| Change | -0.55 | -0.31 | -0.08 | - | +0.17 | +0.42 | +1.62 |
| Level | Minor | Minor | Minor | - | Major | Intermediate | Minor |
Attention could also be paid to pivot points to set price objectives:
| Pivot points | S3 | S2 | S1 | PP | R1 | R2 | R3 |
|---|---|---|---|---|---|---|---|
| Standard | 27.69 | 27.76 | 27.84 | 27.91 | 27.99 | 28.06 | 28.14 |
| Camarilla | 27.87 | 27.88 | 27.90 | 27.91 | 27.92 | 27.94 | 27.95 |
| Woodie | 27.69 | 27.76 | 27.84 | 27.91 | 27.99 | 28.06 | 28.14 |
| Fibonacci | 27.76 | 27.82 | 27.86 | 27.91 | 27.97 | 28.01 | 28.06 |
| Pivot points | S3 | S2 | S1 | PP | R1 | R2 | R3 |
|---|---|---|---|---|---|---|---|
| Standard | 27.16 | 27.50 | 27.70 | 28.04 | 28.24 | 28.58 | 28.78 |
| Camarilla | 27.76 | 27.81 | 27.86 | 27.91 | 27.96 | 28.01 | 28.06 |
| Woodie | 27.10 | 27.47 | 27.64 | 28.01 | 28.18 | 28.55 | 28.72 |
| Fibonacci | 27.50 | 27.70 | 27.83 | 28.04 | 28.24 | 28.37 | 28.58 |
| Pivot points | S3 | S2 | S1 | PP | R1 | R2 | R3 |
|---|---|---|---|---|---|---|---|
| Standard | 25.67 | 26.33 | 26.74 | 27.40 | 27.81 | 28.47 | 28.88 |
| Camarilla | 26.85 | 26.94 | 27.04 | 27.14 | 27.24 | 27.34 | 27.43 |
| Woodie | 25.54 | 26.27 | 26.61 | 27.34 | 27.68 | 28.41 | 28.75 |
| Fibonacci | 26.33 | 26.74 | 27.00 | 27.40 | 27.81 | 28.07 | 28.47 |
Numerical data
The following is the status of technical indicators and moving averages registered at the time this technical analysis was created:
| RSI (14): | 56.62 | |
| MACD (12,26,9): | -0.0100 | |
| Directional Movement: | 6.73 | |
| AROON (14): | 64.29 | |
| DEMA (21): | 28.01 | |
| Parabolic SAR (0,02-0,02-0,2): | 27.86 | |
| Elder Ray (13): | 0.09 | |
| Super Trend (3,10): | 27.87 | |
| Zig ZAG (10): | 28.14 | |
| VORTEX (21): | 0.8500 | |
| Stochastique (14,3,5): | 85.28 | |
| TEMA (21): | 28.04 | |
| Williams %R (14): | -16.67 | |
| Chande Momentum Oscillator (20): | 0.22 | |
| Repulse (5,40,3): | -0.0700 | |
| ROCnROLL: | 1 | |
| TRIX (15,9): | -0.0300 | |
| Courbe Coppock: | 0.54 |
| MA7: | 28.12 | |
| MA20: | 27.83 | |
| MA50: | 27.66 | |
| MA100: | 26.81 | |
| MAexp7: | 28.08 | |
| MAexp20: | 28.04 | |
| MAexp50: | 28.08 | |
| MAexp100: | 27.99 | |
| Price / MA7: | +0.07% | |
| Price / MA20: | +1.11% | |
| Price / MA50: | +1.74% | |
| Price / MA100: | +4.96% | |
| Price / MAexp7: | +0.21% | |
| Price / MAexp20: | +0.36% | |
| Price / MAexp50: | +0.21% | |
| Price / MAexp100: | +0.54% |
News
Don't forget to follow the news on REAVES UTILITY INCOME FUND. At the time of publication of this analysis, the latest news was as follows:
- Reaves Utility Income Fund Announces Regular Monthly Distributions 0f $0.19 Per Share
- Reaves Utility Income Fund Section 19(a) Notice
- Reaves Utility Income Fund Section 19(a) Notice
- Reaves Utility Income Fund Section 19(a) Notice
- Reaves Utility Income Fund Announces Regular Monthly Distributions of $0.19 per Share
About author
Online


Add a comment
Comments
0 comments on the analysis REAVES UTILITY INCOME FUND - 1H