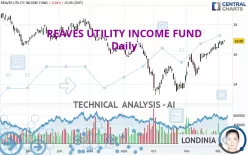
REAVES UTILITY INCOME FUND - Daily - Technical analysis published on 12/07/2023 (GMT)
- 129
- 0
Click here for a new analysis!
- Timeframe : Daily
- - Analysis generated on
- Status : TARGET REACHED

Summary of the analysis

Additional analysis
Quotes
The REAVES UTILITY INCOME FUND rating is 26.89 USD. On the day, this instrument lost -0.04% and was between 26.81 USD and 26.95 USD. This implies that the price is at +0.30% from its lowest and at -0.22% from its highest.The Central Gaps scanner detects the formation of a bullish gap marking the strong presence of buyers against sellers at the opening. This formed a quotation gap.
Opening Gap UP
Type : Bullish
Timeframe : Openning
Here is a more detailed summary of the historical variations registered by REAVES UTILITY INCOME FUND:
Near a new HIGH record (1 month)
Type : Bullish
Timeframe : Weekly
Technical
Technical analysis of REAVES UTILITY INCOME FUND in Daily shows a strongly overall bullish trend. The signals given by the moving averages are 85.71% bullish. This strong bullish trend is confirmed by the strong signals currently being given by short-term moving averages. The Central Indicators market scanner is currently detecting a bullish signal that could impact this trend:
Bullish trend reversal : Moving Average 100
Type : Bullish
Timeframe : Daily
In fact, 14 technical indicators on 18 studied are currently positioned bullish. Caution: the Central Indicators scanner currently detects an excess:
CCI indicator is overbought : over 100
Type : Neutral
Timeframe : Daily
Williams %R indicator is overbought : over -20
Type : Neutral
Timeframe : Daily
The Central Patterns scanner, which studies chart patterns, resistances and supports, has identified this signal:
Near resistance of channel
Type : Bearish
Timeframe : Daily
The Central Candlesticks scanner which studies Japanese candlesticks did not detect anything.
| S3 | S2 | S1 | Price | R1 | R2 | R3 | |
|---|---|---|---|---|---|---|---|
| ProTrendLines | 24.44 | 25.65 | 26.34 | 26.89 | 26.90 | 27.40 | 27.85 |
| Change (%) | -9.11% | -4.61% | -2.05% | - | +0.04% | +1.90% | +3.57% |
| Change | -2.45 | -1.24 | -0.55 | - | +0.01 | +0.51 | +0.96 |
| Level | Intermediate | Major | Major | - | Intermediate | Major | Minor |
To determine price objectives, it is also possible to use the pivot points. Here is the price position in relation to pivot points:
| Pivot points | S3 | S2 | S1 | PP | R1 | R2 | R3 |
|---|---|---|---|---|---|---|---|
| Standard | 26.52 | 26.59 | 26.75 | 26.82 | 26.98 | 27.05 | 27.21 |
| Camarilla | 26.84 | 26.86 | 26.88 | 26.90 | 26.92 | 26.94 | 26.96 |
| Woodie | 26.56 | 26.61 | 26.79 | 26.84 | 27.02 | 27.07 | 27.25 |
| Fibonacci | 26.59 | 26.68 | 26.74 | 26.82 | 26.91 | 26.97 | 27.05 |
| Pivot points | S3 | S2 | S1 | PP | R1 | R2 | R3 |
|---|---|---|---|---|---|---|---|
| Standard | 25.86 | 26.04 | 26.41 | 26.59 | 26.96 | 27.14 | 27.51 |
| Camarilla | 26.62 | 26.67 | 26.72 | 26.77 | 26.82 | 26.87 | 26.92 |
| Woodie | 25.95 | 26.09 | 26.50 | 26.64 | 27.05 | 27.19 | 27.60 |
| Fibonacci | 26.04 | 26.25 | 26.38 | 26.59 | 26.80 | 26.93 | 27.14 |
| Pivot points | S3 | S2 | S1 | PP | R1 | R2 | R3 |
|---|---|---|---|---|---|---|---|
| Standard | 22.50 | 23.39 | 24.91 | 25.80 | 27.32 | 28.21 | 29.73 |
| Camarilla | 25.76 | 25.98 | 26.20 | 26.42 | 26.64 | 26.86 | 27.08 |
| Woodie | 22.81 | 23.55 | 25.22 | 25.96 | 27.63 | 28.37 | 30.04 |
| Fibonacci | 23.39 | 24.31 | 24.88 | 25.80 | 26.72 | 27.29 | 28.21 |
Numerical data
The following is the status of technical indicators and moving averages registered at the time this technical analysis was created:
| RSI (14): | 69.39 | |
| MACD (12,26,9): | 0.5200 | |
| Directional Movement: | 19.38 | |
| AROON (14): | 85.71 | |
| DEMA (21): | 26.82 | |
| Parabolic SAR (0,02-0,02-0,2): | 26.59 | |
| Elder Ray (13): | 0.44 | |
| Super Trend (3,10): | 25.95 | |
| Zig ZAG (10): | 26.92 | |
| VORTEX (21): | 1.1600 | |
| Stochastique (14,3,5): | 90.79 | |
| TEMA (21): | 27.11 | |
| Williams %R (14): | -4.04 | |
| Chande Momentum Oscillator (20): | 0.89 | |
| Repulse (5,40,3): | 0.8200 | |
| ROCnROLL: | 1 | |
| TRIX (15,9): | 0.2900 | |
| Courbe Coppock: | 9.25 |
| MA7: | 26.69 | |
| MA20: | 26.09 | |
| MA50: | 24.96 | |
| MA100: | 25.55 | |
| MAexp7: | 26.70 | |
| MAexp20: | 26.16 | |
| MAexp50: | 25.60 | |
| MAexp100: | 25.66 | |
| Price / MA7: | +0.75% | |
| Price / MA20: | +3.07% | |
| Price / MA50: | +7.73% | |
| Price / MA100: | +5.24% | |
| Price / MAexp7: | +0.71% | |
| Price / MAexp20: | +2.79% | |
| Price / MAexp50: | +5.04% | |
| Price / MAexp100: | +4.79% |
News
The last news published on REAVES UTILITY INCOME FUND at the time of the generation of this analysis was as follows:
- Reaves Utility Income Fund Section 19(a) Notice
- Reaves Utility Income Fund Section 19(a) Notice
- Reaves Utility Income Fund Announces Regular Monthly Distribution of $0.19 per Share
- Reaves Utility Income Fund Section 19(a) Notice
- Reaves Utility Income Fund Section 19(a) Notice
About author
Online


Add a comment
Comments
0 comments on the analysis REAVES UTILITY INCOME FUND - Daily