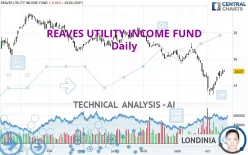
REAVES UTILITY INCOME FUND - Daily - Technical analysis published on 10/17/2023 (GMT)
- 101
- 0
Click here for a new analysis!
- Timeframe : Daily
- - Analysis generated on
- Status : LEVEL MAINTAINED

Summary of the analysis

Additional analysis
Quotes
The REAVES UTILITY INCOME FUND rating is 25.07 USD. The price registered a decrease of -0.36% on the session and was traded between 25.01 USD and 25.23 USD over the period. The price is currently at +0.24% from its lowest and -0.63% from its highest.A bearish opening was detected by the Central Gaps scanner. Sellers are trying to impose a bearish trend in the very short term.
Bearish opening
Type : Bearish
Timeframe : Openning
Here is a more detailed summary of the historical variations registered by REAVES UTILITY INCOME FUND:
Technical
A technical analysis in Daily of this REAVES UTILITY INCOME FUND chart shows a bearish trend. The signals given by moving averages are 75.00% bearish. This bearish trend could slow down given the neutral signals currently being given by short-term moving averages. The Central Indicators market scanner is currently detecting a bullish signal that could impact this trend:
Bullish trend reversal : adaptative moving average 20
Type : Bullish
Timeframe : Daily
In fact, according to the parameters integrated into the Central Analyzer system, 13 technical indicators out of 18 analysed are currently bullish. Caution: the Central Indicators scanner currently detects an excess:
Williams %R indicator is overbought : over -20
Type : Neutral
Timeframe : Daily
RSI indicator is back under 50
Type : Bearish
Timeframe : Daily
Aroon indicator bullish trend
Type : Bullish
Timeframe : Daily
The Central Patterns scanner, which studies chart patterns, resistances and supports, has identified these signals:
Near horizontal resistance
Type : Bearish
Timeframe : Daily
Resistance of channel is broken
Type : Bullish
Timeframe : Daily
The Central Candlesticks scanner currently notes the presence of this pattern in Japanese candlesticks that could mark the end of the short-term trend currently underway:
Doji
Type : Neutral
Timeframe : Daily
| S3 | S2 | S1 | Price | R1 | R2 | R3 | |
|---|---|---|---|---|---|---|---|
| ProTrendLines | 17.16 | 20.21 | 23.40 | 25.07 | 25.91 | 26.74 | 27.82 |
| Change (%) | -31.55% | -19.39% | -6.66% | - | +3.35% | +6.66% | +10.97% |
| Change | -7.91 | -4.86 | -1.67 | - | +0.84 | +1.67 | +2.75 |
| Level | Minor | Major | Major | - | Major | Major | Intermediate |
Attention could also be paid to pivot points to set price objectives:
| Pivot points | S3 | S2 | S1 | PP | R1 | R2 | R3 |
|---|---|---|---|---|---|---|---|
| Standard | 24.51 | 24.67 | 24.92 | 25.08 | 25.33 | 25.49 | 25.74 |
| Camarilla | 25.05 | 25.09 | 25.12 | 25.16 | 25.20 | 25.24 | 25.27 |
| Woodie | 24.55 | 24.69 | 24.96 | 25.10 | 25.37 | 25.51 | 25.78 |
| Fibonacci | 24.67 | 24.83 | 24.93 | 25.08 | 25.24 | 25.34 | 25.49 |
| Pivot points | S3 | S2 | S1 | PP | R1 | R2 | R3 |
|---|---|---|---|---|---|---|---|
| Standard | 23.11 | 23.56 | 24.18 | 24.63 | 25.25 | 25.70 | 26.32 |
| Camarilla | 24.50 | 24.59 | 24.69 | 24.79 | 24.89 | 24.99 | 25.08 |
| Woodie | 23.19 | 23.60 | 24.26 | 24.67 | 25.33 | 25.74 | 26.40 |
| Fibonacci | 23.56 | 23.97 | 24.23 | 24.63 | 25.04 | 25.30 | 25.70 |
| Pivot points | S3 | S2 | S1 | PP | R1 | R2 | R3 |
|---|---|---|---|---|---|---|---|
| Standard | 21.30 | 22.92 | 23.78 | 25.40 | 26.26 | 27.88 | 28.74 |
| Camarilla | 23.97 | 24.20 | 24.42 | 24.65 | 24.88 | 25.11 | 25.33 |
| Woodie | 20.93 | 22.73 | 23.41 | 25.21 | 25.89 | 27.69 | 28.37 |
| Fibonacci | 22.92 | 23.86 | 24.45 | 25.40 | 26.34 | 26.93 | 27.88 |
Numerical data
The following are the details of the technical indicators and moving averages that were collected to generate this technical analysis:
| RSI (14): | 49.55 | |
| MACD (12,26,9): | -0.2900 | |
| Directional Movement: | -7.14 | |
| AROON (14): | 64.29 | |
| DEMA (21): | 24.45 | |
| Parabolic SAR (0,02-0,02-0,2): | 23.68 | |
| Elder Ray (13): | 0.35 | |
| Super Trend (3,10): | 23.85 | |
| Zig ZAG (10): | 25.06 | |
| VORTEX (21): | 0.8200 | |
| Stochastique (14,3,5): | 82.61 | |
| TEMA (21): | 24.52 | |
| Williams %R (14): | -9.95 | |
| Chande Momentum Oscillator (20): | 0.41 | |
| Repulse (5,40,3): | 0.5600 | |
| ROCnROLL: | -1 | |
| TRIX (15,9): | -0.2600 | |
| Courbe Coppock: | 4.23 |
| MA7: | 24.78 | |
| MA20: | 24.79 | |
| MA50: | 25.68 | |
| MA100: | 26.33 | |
| MAexp7: | 24.81 | |
| MAexp20: | 24.90 | |
| MAexp50: | 25.54 | |
| MAexp100: | 26.15 | |
| Price / MA7: | +1.17% | |
| Price / MA20: | +1.13% | |
| Price / MA50: | -2.38% | |
| Price / MA100: | -4.79% | |
| Price / MAexp7: | +1.05% | |
| Price / MAexp20: | +0.68% | |
| Price / MAexp50: | -1.84% | |
| Price / MAexp100: | -4.13% |
News
The latest news and videos published on REAVES UTILITY INCOME FUND at the time of the analysis were as follows:
- Reaves Utility Income Fund Announces Regular Monthly Distribution of $0.19 per Share
- Reaves Utility Income Fund Section 19(a) Notice
- Reaves Utility Income Fund Section 19(a) Notice
- Reaves Utility Income Fund Section 19(a) Notice
- Reaves Utility Income Fund Announces Regular Monthly Distribution of $0.19 per Share
About author
Online


Add a comment
Comments
0 comments on the analysis REAVES UTILITY INCOME FUND - Daily