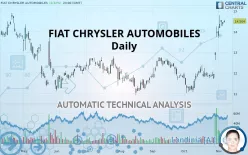
FIAT CHRYSLER AUTOMOBILES - Daily - Technical analysis published on 11/08/2019 (GMT)
- 327
- 0
- Who voted?
Click here for a new analysis!
- Timeframe : Daily
- - Analysis generated on
- Status : TARGET REACHED

Summary of the analysis
Additional analysis
Quotes
FIAT CHRYSLER AUTOMOBILES rating 14.504 EUR. The price registered an increase of +0.32% on the session with the lowest point at 14.426 EUR and the highest point at 14.580 EUR. The deviation from the price is +0.54% for the low point and -0.52% for the high point.The Central Gaps scanner detects a bearish opening. A small advantage for sellers in the very short term.
Bearish opening
Type : Bearish
Timeframe : Openning
Here is a more detailed summary of the historical variations registered by FIAT CHRYSLER AUTOMOBILES:
Near a new HIGH record (1 month)
Type : Bullish
Timeframe : Weekly
The Central Volumes scanner detects abnormal volumes on the asset:
Abnormal volumes
Timeframe : 5 days
Technical
Technical analysis of FIAT CHRYSLER AUTOMOBILES in Daily shows a strongly overall bullish trend. The signals given by the moving averages are 92.86% bullish. This strong bullish trend is confirmed by the strong signals currently being given by short-term moving averages. There is no crossing of moving average by the price or crossing of moving averages between themselves.
In fact, 16 technical indicators on 18 studied are currently positioned bullish. But beware of excesses. The Central Indicators scanner currently detects this:
RSI indicator is overbought : over 80
Type : Neutral
Timeframe : Daily
CCI indicator is overbought : over 100
Type : Neutral
Timeframe : Daily
Previous candle closed over Bollinger bands
Type : Neutral
Timeframe : Daily
Williams %R indicator is overbought : over -20
Type : Neutral
Timeframe : Daily
Pivot points : price is over resistance 3
Type : Neutral
Timeframe : Weekly
The Central Patterns scanner, which studies chart patterns, resistances and supports, has identified these signals:
Near resistance of channel
Type : Bearish
Timeframe : Daily
Horizontal resistance is broken
Type : Bullish
Timeframe : Daily
The Central Candlesticks scanner, specialised in Japanese candlesticks, did not identify any signals.
| S3 | S2 | S1 | Price | R1 | R2 | R3 | |
|---|---|---|---|---|---|---|---|
| ProTrendLines | 12.416 | 13.393 | 14.060 | 14.504 | 14.706 | 15.240 | 19.844 |
| Change (%) | -14.40% | -7.66% | -3.06% | - | +1.39% | +5.07% | +36.82% |
| Change | -2.088 | -1.111 | -0.444 | - | +0.202 | +0.736 | +5.340 |
| Level | Major | Minor | Intermediate | - | Major | Major | Major |
Attention could also be paid to pivot points to set price objectives:
| Pivot points | S3 | S2 | S1 | PP | R1 | R2 | R3 |
|---|---|---|---|---|---|---|---|
| Standard | 13.989 | 14.127 | 14.289 | 14.427 | 14.589 | 14.727 | 14.889 |
| Camarilla | 14.368 | 14.395 | 14.423 | 14.450 | 14.478 | 14.505 | 14.533 |
| Woodie | 14.000 | 14.133 | 14.300 | 14.433 | 14.600 | 14.733 | 14.900 |
| Fibonacci | 14.127 | 14.242 | 14.313 | 14.427 | 14.542 | 14.613 | 14.727 |
| Pivot points | S3 | S2 | S1 | PP | R1 | R2 | R3 |
|---|---|---|---|---|---|---|---|
| Standard | 11.149 | 11.453 | 11.651 | 11.955 | 12.153 | 12.457 | 12.655 |
| Camarilla | 11.710 | 11.756 | 11.802 | 11.848 | 11.894 | 11.940 | 11.986 |
| Woodie | 11.095 | 11.427 | 11.597 | 11.929 | 12.099 | 12.431 | 12.601 |
| Fibonacci | 11.453 | 11.645 | 11.764 | 11.955 | 12.147 | 12.266 | 12.457 |
| Pivot points | S3 | S2 | S1 | PP | R1 | R2 | R3 |
|---|---|---|---|---|---|---|---|
| Standard | 8.685 | 9.861 | 11.895 | 13.071 | 15.105 | 16.281 | 18.315 |
| Camarilla | 13.045 | 13.340 | 13.634 | 13.928 | 14.222 | 14.517 | 14.811 |
| Woodie | 9.113 | 10.076 | 12.323 | 13.286 | 15.533 | 16.496 | 18.743 |
| Fibonacci | 9.861 | 11.088 | 11.845 | 13.071 | 14.298 | 15.055 | 16.281 |
Numerical data
The following are the details of the technical indicators and moving averages that were collected to generate this technical analysis:
| RSI (14): | 81.85 | |
| MACD (12,26,9): | 0.6210 | |
| Directional Movement: | 36.856 | |
| AROON (14): | 28.571 | |
| DEMA (21): | 13.535 | |
| Parabolic SAR (0,02-0,02-0,2): | 12.394 | |
| Elder Ray (13): | 1.141 | |
| Super Trend (3,10): | 13.048 | |
| Zig ZAG (10): | 14.458 | |
| VORTEX (21): | 1.1540 | |
| Stochastique (14,3,5): | 88.43 | |
| TEMA (21): | 14.073 | |
| Williams %R (14): | -10.50 | |
| Chande Momentum Oscillator (20): | 2.456 | |
| Repulse (5,40,3): | 1.1000 | |
| ROCnROLL: | 1 | |
| TRIX (15,9): | 0.3590 | |
| Courbe Coppock: | 29.68 |
| MA7: | 13.691 | |
| MA20: | 12.545 | |
| MA50: | 12.234 | |
| MA100: | 12.131 | |
| MAexp7: | 13.797 | |
| MAexp20: | 12.866 | |
| MAexp50: | 12.368 | |
| MAexp100: | 12.320 | |
| Price / MA7: | +5.94% | |
| Price / MA20: | +15.62% | |
| Price / MA50: | +18.55% | |
| Price / MA100: | +19.56% | |
| Price / MAexp7: | +5.12% | |
| Price / MAexp20: | +12.73% | |
| Price / MAexp50: | +17.27% | |
| Price / MAexp100: | +17.73% |
News
The latest news and videos published on FIAT CHRYSLER AUTOMOBILES at the time of the analysis were as follows:
- S&P places FCA N.V. on CreditWatch Positive
- 2020 Chrysler Voyager Launches With Five-star Safety Rating
- Moody’s improves outlook on FCA N.V.’s rating
- FCA NV Q3 2019 Results
- Groupe PSA and FCA plan to join forces to build a world leader for a new era in sustainable mobility
About author

Online


Add a comment
Comments
0 comments on the analysis FIAT CHRYSLER AUTOMOBILES - Daily