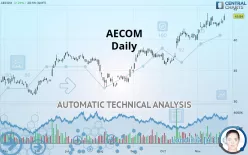
AECOM - Daily - Technical analysis published on 11/28/2019 (GMT)
- 368
- 0
- Who voted?
Click here for a new analysis!
- Timeframe : Daily
- - Analysis generated on
- Status : INVALID

Summary of the analysis

Additional analysis
Quotes
The AECOM price is 43.84 USD. The price has increased by +2.29% since the last closing and was between 43.21 USD and 44.16 USD. This implies that the price is at +1.46% from its lowest and at -0.72% from its highest.The Central Gaps scanner detects a bullish opening. A small advantage for buyers in the very short term.
Bullish opening
Type : Bullish
Timeframe : Openning
Here is a more detailed summary of the historical variations registered by AECOM:
Near a new HIGH record (5 years)
Type : Bullish
Timeframe : Weekly
Near a new HIGH record (1 year)
Type : Bullish
Timeframe : Weekly
Near a new HIGH record (1st january)
Type : Bullish
Timeframe : Weekly
Near a new HIGH record (1 month)
Type : Bullish
Timeframe : Weekly
Technical
Technical analysis of AECOM in Daily shows a strongly overall bullish trend. 92.86% of the signals given by moving averages are bullish. This strongly bullish trend is supported by the strong bullish signals given by short-term moving averages. The Central Indicators market scanner currently does not detect any result that concerns moving averages.
In fact, 14 technical indicators on 18 studied are currently bullish. Caution: the Central Indicators scanner currently detects an excess:
CCI indicator is overbought : over 100
Type : Neutral
Timeframe : Daily
MACD indicator: bullish divergence
Type : Bullish
Timeframe : Daily
Williams %R indicator is overbought : over -20
Type : Neutral
Timeframe : Daily
Pivot points : price is over resistance 3
Type : Neutral
Timeframe : Daily
Pivot points : price is over resistance 3
Type : Neutral
Timeframe : Weekly
Price is back under the pivot point
Type : Bearish
Timeframe : Daily
Williams %R indicator is back over -50
Type : Bullish
Timeframe : Daily
No signals are given by Central Patterns, a market scanner specialised in chart patterns, resistances and supports.
The Central Candlesticks scanner which studies Japanese candlesticks did not detect anything.
| S3 | S2 | S1 | Price | |
|---|---|---|---|---|
| ProTrendLines | 37.85 | 40.13 | 43.51 | 43.84 |
| Change (%) | -13.66% | -8.46% | -0.75% | - |
| Change | -5.99 | -3.71 | -0.33 | - |
| Level | Major | Major | Intermediate | - |
To determine price objectives, it is also possible to use the pivot points. Here is the price position in relation to pivot points:
| Pivot points | S3 | S2 | S1 | PP | R1 | R2 | R3 |
|---|---|---|---|---|---|---|---|
| Standard | 42.01 | 42.33 | 42.59 | 42.91 | 43.17 | 43.49 | 43.75 |
| Camarilla | 42.70 | 42.75 | 42.81 | 42.86 | 42.91 | 42.97 | 43.02 |
| Woodie | 41.99 | 42.32 | 42.57 | 42.90 | 43.15 | 43.48 | 43.73 |
| Fibonacci | 42.33 | 42.55 | 42.69 | 42.91 | 43.13 | 43.27 | 43.49 |
| Pivot points | S3 | S2 | S1 | PP | R1 | R2 | R3 |
|---|---|---|---|---|---|---|---|
| Standard | 41.42 | 41.79 | 42.22 | 42.59 | 43.02 | 43.39 | 43.82 |
| Camarilla | 42.44 | 42.51 | 42.59 | 42.66 | 42.73 | 42.81 | 42.88 |
| Woodie | 41.46 | 41.81 | 42.26 | 42.61 | 43.06 | 43.41 | 43.86 |
| Fibonacci | 41.79 | 42.09 | 42.28 | 42.59 | 42.89 | 43.08 | 43.39 |
| Pivot points | S3 | S2 | S1 | PP | R1 | R2 | R3 |
|---|---|---|---|---|---|---|---|
| Standard | 30.57 | 33.20 | 36.60 | 39.23 | 42.63 | 45.26 | 48.66 |
| Camarilla | 38.35 | 38.91 | 39.46 | 40.01 | 40.56 | 41.12 | 41.67 |
| Woodie | 30.97 | 33.39 | 37.00 | 39.42 | 43.03 | 45.45 | 49.06 |
| Fibonacci | 33.20 | 35.50 | 36.92 | 39.23 | 41.53 | 42.95 | 45.26 |
Numerical data
The following is the status of the technical indicators and moving averages at the time of publication of this technical analysis:
| RSI (14): | 68.21 | |
| MACD (12,26,9): | 0.8300 | |
| Directional Movement: | 23.32 | |
| AROON (14): | 7.14 | |
| DEMA (21): | 43.51 | |
| Parabolic SAR (0,02-0,02-0,2): | 42.27 | |
| Elder Ray (13): | 0.96 | |
| Super Trend (3,10): | 41.18 | |
| Zig ZAG (10): | 43.84 | |
| VORTEX (21): | 1.0900 | |
| Stochastique (14,3,5): | 55.84 | |
| TEMA (21): | 43.41 | |
| Williams %R (14): | -21.14 | |
| Chande Momentum Oscillator (20): | 0.84 | |
| Repulse (5,40,3): | 0.9900 | |
| ROCnROLL: | 1 | |
| TRIX (15,9): | 0.3300 | |
| Courbe Coppock: | 5.11 |
| MA7: | 42.85 | |
| MA20: | 42.45 | |
| MA50: | 40.15 | |
| MA100: | 37.88 | |
| MAexp7: | 43.02 | |
| MAexp20: | 42.33 | |
| MAexp50: | 40.57 | |
| MAexp100: | 38.57 | |
| Price / MA7: | +2.31% | |
| Price / MA20: | +3.27% | |
| Price / MA50: | +9.19% | |
| Price / MA100: | +15.73% | |
| Price / MAexp7: | +1.91% | |
| Price / MAexp20: | +3.57% | |
| Price / MAexp50: | +8.06% | |
| Price / MAexp100: | +13.66% |
News
The latest news and videos published on AECOM at the time of the analysis were as follows:
- AECOM to announce fourth quarter and full year fiscal 2019 results on November 12th
- AECOM accelerates value creation strategy with sale of its Management Services business for $2.405 billion
- Starboard Delivers Letter to AECOM CEO and Board of Directors
- AECOM’s 2019 Future of Infrastructure Report Shows Riyadh Citizens Want Better Engagement and More Private Sector Involvement in the Development of Their Infrastructure
- Engine Capital Issues Open Letter to AECOM Shareholders
About author

Online


Add a comment
Comments
0 comments on the analysis AECOM - Daily