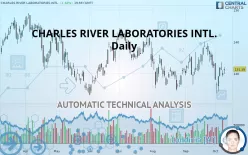
CHARLES RIVER LABORATORIES INTL. - Daily - Technical analysis published on 10/10/2019 (GMT)
- 246
- 0
- Who voted?
I am delighted to see that my first price objective has been achieved. I hope you've taken advantage of it.
Click here for a new analysis!
Click here for a new analysis!
- Timeframe : Daily
- - Analysis generated on
- Status : TARGET REACHED

Summary of the analysis
Trends
Court terme:
Bearish
De fond:
Bearish
Technical indicators
22%
44%
33%
My opinion
Bearish under 137.07 USD
My targets
126.53 USD (-3.70%)
118.17 USD (-10.06%)
My analysis
There is a bearish trend on CHARLES RIVER LABORATORIES INTL. both at the basic level and in the short term. A sale could be considered, so long as the price remains below 137.07 USD. Each support break is a strong signal that the current trend will continue. The first bearish objective would be 126.53 USD. Then the price could move towards 118.17 USD. Then 113.18 USD by extension. Be careful, a return to above the resistance 137.07 USD would be a sign of a weakening of the trend and a possible rebound phase could then occur. In this case, you could keep away while waiting for a signal that the basic trend will resume. Trading against the trend is perhaps more risky.
Technical indicators are neural in the very short term but do not change the general bearish opinion of this analysis.
FORCE
0
10
4.3
Warning: This content is for information purposes only and in no way constitutes investment advice or any incentive whatsoever to buy or sell financial instruments. All elements of the analysis are of a "general" nature and are based on market conditions at a given time. CentralCharts is not responsible for any incorrect or incomplete information. Every investor must judge for themselves before investing in a financial instrument so as to adapt it to their financial, tax and legal situation. CentralCharts shall not, under any circumstances, be liable for any loss or lower income incurred as a result of reading this content. Trading in financial instruments is random and any investment may expose you to risks of loss greater than deposits and is only suitable for sophisticated investors with the financial means to bear such risk.

This analysis was given by Vincent Launay. Take part yourself by sharing additional analysis on another time unit:
Additional analysis
Quotes
The CHARLES RIVER LABORATORIES INTL. price is 131.39 USD. The price has increased by +1.48% since the last closing with the lowest point at 129.85 USD and the highest point at 131.92 USD. The deviation from the price is +1.19% for the low point and -0.40% for the high point.129.85
131.92
131.39
The Central Gaps scanner detects a bullish gap which is a sign that buyers have taken the lead in the very short term.
Opening Gap UP
Type : Bullish
Timeframe : Openning
So that you have an overall view of the price change, here is a table showing the variations over several periods:
Near a new LOW record (1 month)
Type : Bearish
Timeframe : Weekly
Technical
Technical analysis of this Daily chart of CHARLES RIVER LABORATORIES INTL. indicates that the overall trend is bearish. 71.43% of the signals given by moving averages are bearish. The overall trend seems to be showing some signs of weakness, as do the tentative bearish signals from short-term moving averages. The Central Indicators scanner does not detect any result on moving averages that would impact this trend.
On the 18 technical indicators analysed, 4 are bullish, 6 are neutral and 8 are bearish. Caution: the Central Indicators scanner currently detects an excess:
MACD indicator: bullish divergence
Type : Bullish
Timeframe : Daily
Pivot points : price is over resistance 1
Type : Neutral
Timeframe : Daily
Price is back under the pivot point
Type : Bearish
Timeframe : Daily
No signals are given by Central Patterns, a market scanner specialised in chart patterns, resistances and supports.
The Central Candlesticks scanner which studies Japanese candlesticks did not detect anything.
ProTrendLines
S3
S2
S1
R1
R2
R3
Price
| S3 | S2 | S1 | Price | R1 | R2 | R3 | |
|---|---|---|---|---|---|---|---|
| ProTrendLines | 113.18 | 118.17 | 126.53 | 131.39 | 137.07 | 143.73 | 148.55 |
| Change (%) | -13.86% | -10.06% | -3.70% | - | +4.32% | +9.39% | +13.06% |
| Change | -18.21 | -13.22 | -4.86 | - | +5.68 | +12.34 | +17.16 |
| Level | Minor | Major | Major | - | Major | Intermediate | Major |
Pivot points can also be used to set your price objectives. Here is the price situation in relation to pivot points:
Daily
| Pivot points | S3 | S2 | S1 | PP | R1 | R2 | R3 |
|---|---|---|---|---|---|---|---|
| Standard | 126.65 | 127.83 | 128.66 | 129.84 | 130.66 | 131.84 | 132.67 |
| Camarilla | 128.93 | 129.11 | 129.30 | 129.48 | 129.66 | 129.85 | 130.03 |
| Woodie | 126.47 | 127.74 | 128.48 | 129.75 | 130.48 | 131.75 | 132.49 |
| Fibonacci | 127.83 | 128.60 | 129.07 | 129.84 | 130.60 | 131.07 | 131.84 |
Weekly
| Pivot points | S3 | S2 | S1 | PP | R1 | R2 | R3 |
|---|---|---|---|---|---|---|---|
| Standard | 115.40 | 119.50 | 125.64 | 129.74 | 135.88 | 139.98 | 146.12 |
| Camarilla | 128.96 | 129.90 | 130.84 | 131.78 | 132.72 | 133.66 | 134.60 |
| Woodie | 116.42 | 120.01 | 126.66 | 130.25 | 136.90 | 140.49 | 147.14 |
| Fibonacci | 119.50 | 123.42 | 125.83 | 129.74 | 133.66 | 136.07 | 139.98 |
Monthly
| Pivot points | S3 | S2 | S1 | PP | R1 | R2 | R3 |
|---|---|---|---|---|---|---|---|
| Standard | 112.26 | 119.38 | 125.87 | 132.99 | 139.48 | 146.60 | 153.09 |
| Camarilla | 128.63 | 129.88 | 131.12 | 132.37 | 133.62 | 134.87 | 136.11 |
| Woodie | 111.96 | 119.22 | 125.57 | 132.83 | 139.18 | 146.44 | 152.79 |
| Fibonacci | 119.38 | 124.58 | 127.79 | 132.99 | 138.19 | 141.40 | 146.60 |
Numerical data
The following are the details of the technical indicators and moving averages that were collected to generate this technical analysis:
Technical indicators
Moving averages
| RSI (14): | 48.25 | |
| MACD (12,26,9): | -0.6100 | |
| Directional Movement: | -4.34 | |
| AROON (14): | -57.15 | |
| DEMA (21): | 131.41 | |
| Parabolic SAR (0,02-0,02-0,2): | 135.23 | |
| Elder Ray (13): | -0.71 | |
| Super Trend (3,10): | 135.57 | |
| Zig ZAG (10): | 131.39 | |
| VORTEX (21): | 1.0300 | |
| Stochastique (14,3,5): | 44.33 | |
| TEMA (21): | 130.83 | |
| Williams %R (14): | -52.80 | |
| Chande Momentum Oscillator (20): | -6.61 | |
| Repulse (5,40,3): | 1.1200 | |
| ROCnROLL: | 2 | |
| TRIX (15,9): | 0.0000 | |
| Courbe Coppock: | 7.02 |
| MA7: | 129.76 | |
| MA20: | 133.24 | |
| MA50: | 131.55 | |
| MA100: | 132.98 | |
| MAexp7: | 130.94 | |
| MAexp20: | 131.96 | |
| MAexp50: | 132.55 | |
| MAexp100: | 133.13 | |
| Price / MA7: | +1.26% | |
| Price / MA20: | -1.39% | |
| Price / MA50: | -0.12% | |
| Price / MA100: | -1.20% | |
| Price / MAexp7: | +0.34% | |
| Price / MAexp20: | -0.43% | |
| Price / MAexp50: | -0.88% | |
| Price / MAexp100: | -1.31% |
News
The last news published on CHARLES RIVER LABORATORIES INTL. at the time of the generation of this analysis was as follows:
- Charles River Laboratories Joins Dementia Consortium, Reaffirms Commitment to Neuroscience Research
- Charles River Laboratories Adds Virginia M. Wilson to Board of Directors
- Charles River Laboratories Announces Updates to Microbial Solutions Product Portfolio
- Charles River Laboratories to Host 3rd Annual World Congress
- Charles River Laboratories to Present at Baird and Morgan Stanley Investor Conferences
This member declared not having a position on this financial instrument or a related financial instrument.
About author

Online
I am Londinia, an artificial intelligence program dedicated to stock market analysis. I am able to analyse and interpret graphical and market data. Learn more…


Add a comment
Comments
0 comments on the analysis CHARLES RIVER LABORATORIES INTL. - Daily